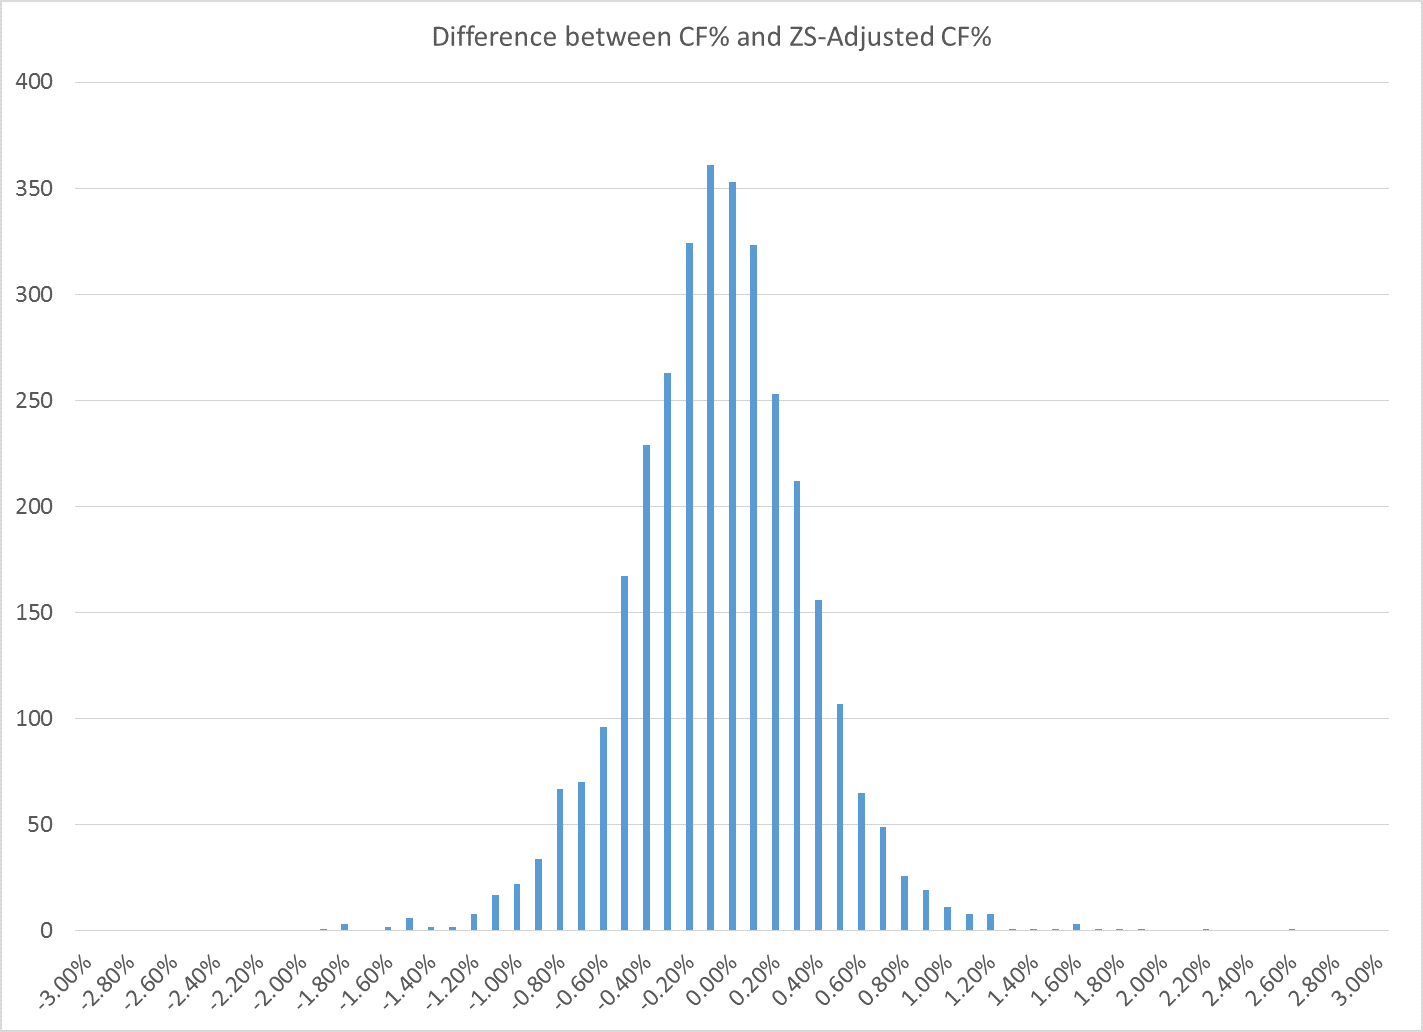
It was the second article that I read about a year ago that may be start to dismiss the binary statement of "Dzone start = expected low production" when none of it account for on-the-fly changes. I still have not found a chart showing the distribution of face-off start (by zone) and change-on-the-fly.
It's why I've been critical of the statements/arugment against (or for) guys like Carter where I (or anyone) says: Jeff Carter sucks. And the reply is "well his dzone start is 50+% so that justifies it". No, that means Jeff Carter and his line have an inability to effectively leave the zone and gain the offensive blue line. That's the issue. Not the zone start. Throughout the course of the game, a player will find themselves on both ends of the ice and the goals and expectations will be the same, regardless of where they started. If they can't exit the zone...of what f***ing good are they and why would be keep having them start in the dzone?
If you want to match up two adv stats to make the worthwhile, check dzone starts and combine them with dzone exits and ozone entries.


