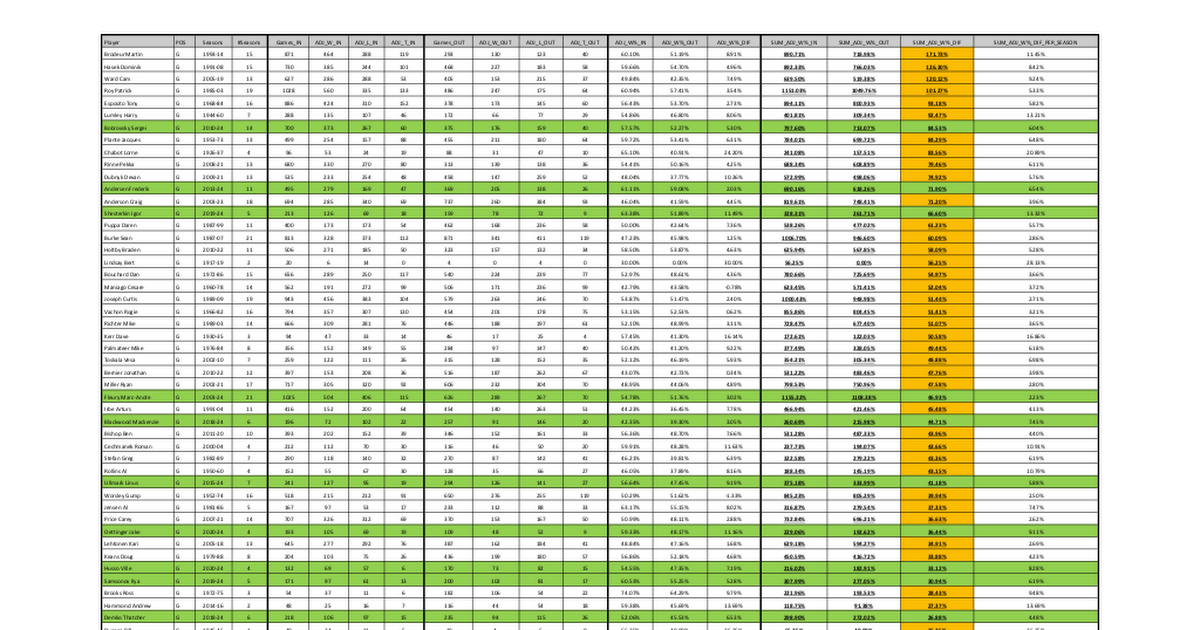
Win Percentage DIF. Of A Team When The Player Is VS Isn't In The Lineup (REG. Seasons 1917-2024)

pnep

Registered User
Mar 10, 2004
3,062
1,758
Novosibirsk,Russia
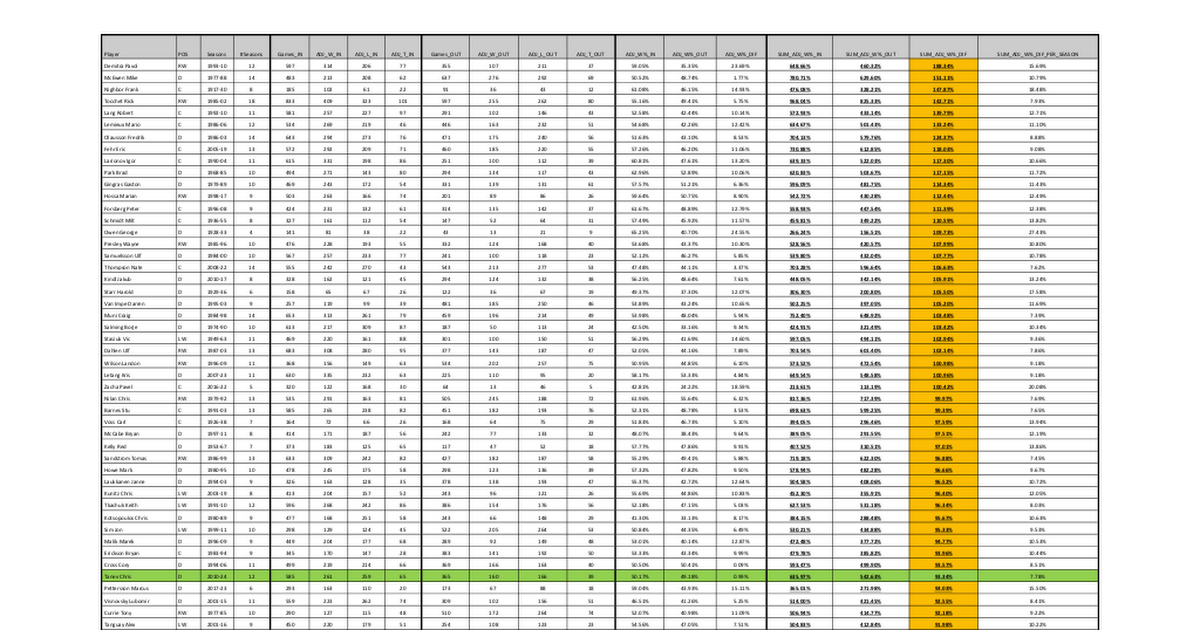
Win Percentage DIF. Of A Team When The Player Is VS Isn't In The Lineup (REG. Seasons 1917-2024)

Seasons when player played from 10% to 90% team games.

ADJ_W = REG_WINS + OT_WINS
ADJ_L = REG_LOSES + OT_LOSES
ADJ_T = TIES + SH_WINS + SH_LOSES


Skaters (REG. Seasons 1917-2024)


Goalies (REG. Seasons 1917-2024)


Last edited:

Hockey Outsider

Registered User
Jan 16, 2005
9,438
15,595
@pnep - thanks for sending this. I owe you a beer (probably several) if you're ever in Toronto. Your calculation method makes sense.

Let me walk through an example. Consider Steve Yzerman:
  • Steve Yzerman (record in games played): 777 W, 538 L, 185 T, 14 OTL (1,514 games, 57.9% win percentage)
  • Steve Yzerman (record in games missed): 127 W, 80 L, 25 T, 10 OTL (242 games, 59.7% win percentage)
Taken literally, this suggests that the Detroit Red Wings did better when Yzerman was out of the lineup. This, obviously, is counterintuitive, since Yzerman is one of the top 40 (or so) players in NHL history.

What's the flaw in this methodology? Let's step back. Yzerman was generally healthy at the start of his career (when the "Dead Things" were a poorly-run franchise). He struggled with injuries late in his career, when the Red Wings were (probably) the best team in the NHL. (More than half of the games that Yzerman missed in his entire career were in 2001 through 2003, ages 35 to 37). Essentially, this method "reads" that Detroit did poorly when Yzerman was healthy, and it did better in the games that Yzerman missed. That conclusion is nonsense, because there isn't a level playing field. When Yzerman was missing lots of games, the Red Wings had Lidstrom, Fedorov, Chelios, Shanahan, etc. This simplistic approach ascribes all of the changes in the team's results to one player's presence.

pnep's methodology avoids these cross-career comparisons. Yzerman played 22 seasons. In 15 of them, he played at least 90% of the games (of which, in 13 of them, he played at least 95% of the games). These 15 games are dropped from the analysis entirely. Detroit's record in the two games that Yzerman missed in 1996 (for example) has no informational value.

pnep's results only consider seasons where a player has missed a meaningful number of games. (There are two tabs - one captures all seasons where a player has missed >10% of the games, and the other captures all seasons where a player missed >20%). Specifically, this captures the 1986, 1988, 1994, 2001, 2002, 2003, and 2006 campaigns.

The simple (unweighted) average shows that Detroit had about a 62% win percentage when Yzerman played, and 59% when he didn't. Even that's somewhat misleading, since it includes his 2006 campaign, when he was finished as a player. (Drop his final, dismal year, and we get a simple average of 61% when Yzerman played vs 56% when he didn't - probably not an unreasonable ballpark estimate of Yzerman's impact).

This isn't a problem limited to Yzerman. Denis Potvin has the exact same pattern - he was generally healthy when the Islanders were an expansion team, but started missing games during the dynasty years, so a simple calculations shows that the Islanders did better when Potvin was sitting out.

Using pnep's approach, there's probably some informational value in looking at a team's record when a player is vs isn't in the lineup. (I intend to go through the details in the spreadsheet, and see if anything interesting comes up).

(The main issue with this approach - sample sizes can be tiny. There are some players who missed almost no games during their primes - Howe, Ovechkin, Horton, etc. There simply isn't a way to calculate a meaningful result for them. Even for players who missed time more frequently - Lemieux, Forsberg, Lindros, etc - the sample sizes are still relatively small, and wonky things can happen).
 
Last edited:

The Panther

Registered User
Mar 25, 2014
20,055
17,025
Tokyo, Japan
It's an interesting analysis, but I think this is all kind of meaningless. The situations for each player / team / injury are all so diverse that it just doesn't add up.

A typical player injury might result in 3 or 4 (or 8 or 10) games missed. As we've discussed above, such an injury is too small a sample size and too random to ascribe any actual meaning to the team's results, especially if there weren't many injuries to the given player.

On the other hand, a 30-40 game injury can be really impactful... or it can be much less impactful, depending on situation. For example, if the player says he's going to get surgery in May and probably miss the first half of the season, the team is going to try to replace that player with another player. If we're talking about Mario Lemieux, the club is probably going to make a trade or sign another offensive player to (partly) replace the star. But if the injury to Mario happened in December / January, maybe the club has to play 40 games without him and there's no attempt at "replacing" him. In the first situation, the club might be fine for 40 games, and in the second situation they're really going to struggle (in most cases, or at least logically).

And if the club knows a player is going to miss an entire season, then it's surely going to make adjustments to the line-up to improve the team in that player's absence. Which is hardly the same as a mid-season injury when the guy goes out for 10 games.

There's also the scheduling problem, and the 'doubling-down' of injuries problem. Remember Gretzky missing six games in 1984? The Oilers were a trainwreck without him, which raised some eyebrows at the time. After smoking Calgary in the first game without Wayne, the Oilers (1st overall that season) then lost five in a row, some by embarrassing scores. But while Wayne was out, Messier was also out (at first) and Kurri was out, too! Maybe very different if those two guys were there. Similarly, the five in a row Edmonton lost were all on the road, on a roughly schedule road-trip, in eastern cities where the Oilers tended to struggle anyway. Had those five all been at home and had Messier and Kurri been in the line-up, maybe the Oilers are fine.

So, all of this is to say that I think there are too many factors involved to draw any real conclusions. Maybe in the specific sitaution of a high-impact player getting semi-regularly injured in mid-season for more than 10 games but less than 25 games, every time, we could draw some sort of conclusion.... but even then, I doubt it's a valid one. (Not trying to be Debbie Downer, but just my opinion...)
 

MadLuke

Registered User
Jan 18, 2011
10,667
6,173
For goaltender, specially if there is strong claim of being a team product it could be, as the volume of games and it will be every year, etc..

Their replacement can be quite noisy too, when Roy was playing Hayworth non game and vice versa that different than some others situation. So like always it make it a need to look at what is going on like always. Same goes for anyone, if Gretzky miss and it mean Messier get a bigger role (or Sakic-Forsberg, Crosby-Malkin, that not that same then when montreal missed Koivu)

For offensive stars missing time, maybe the team offensive numbers could be interesting to see and in a way more tellings.

Career are so long and those situational difference that it could be interesting to split them in their 5-6-7 best year or something like that, that number for Jagr whole career for example, would feel hard to have some grasp on it, while it is easy for Bossy-Orr.

But that a lot of work over a lot of work.
 

Ad

Ad

Ad