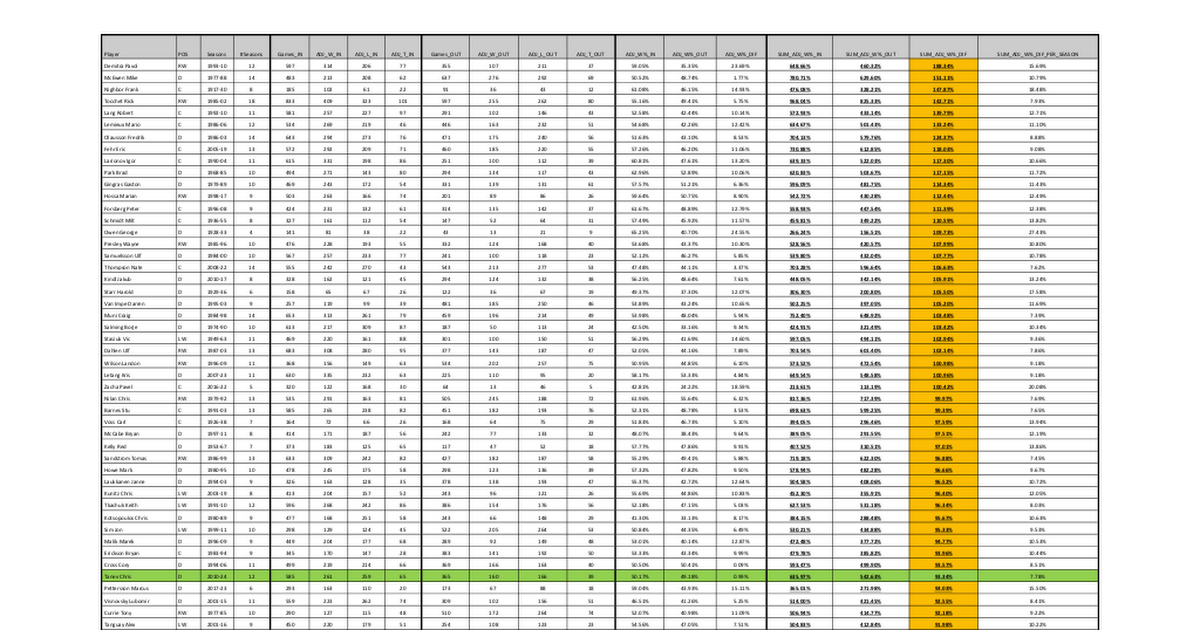
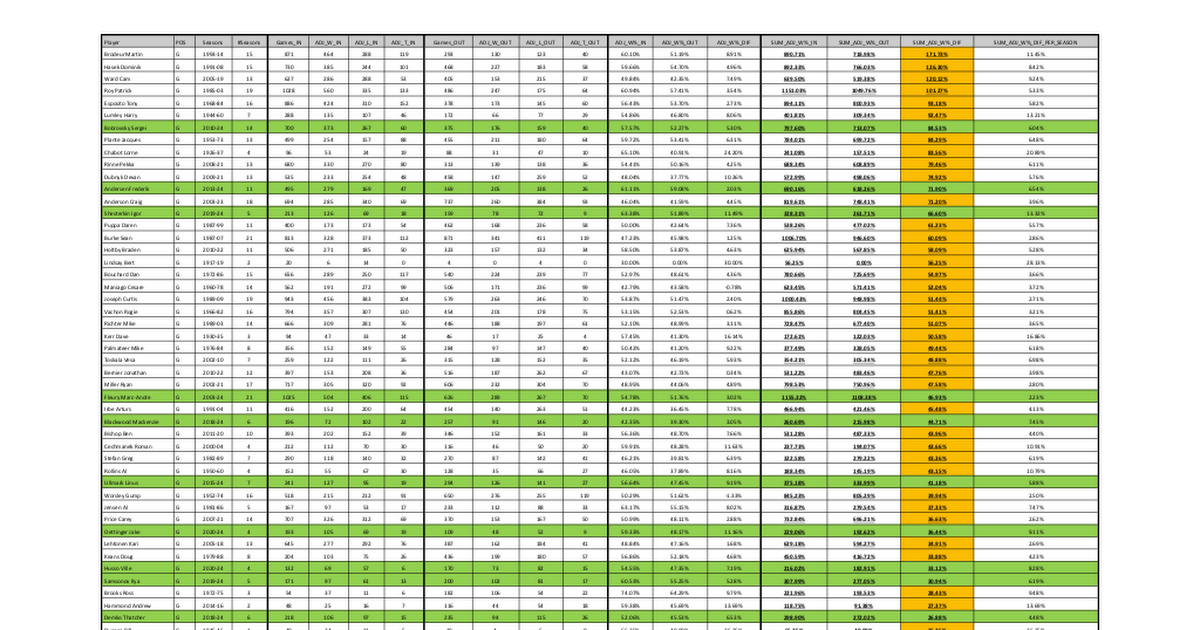
@pnep - thanks for sending this. I owe you a beer (probably several) if you're ever in Toronto. Your calculation method makes sense.
Let me walk through an example. Consider Steve Yzerman:
- Steve Yzerman (record in games played): 777 W, 538 L, 185 T, 14 OTL (1,514 games, 57.9% win percentage)
- Steve Yzerman (record in games missed): 127 W, 80 L, 25 T, 10 OTL (242 games, 59.7% win percentage)
Taken literally, this suggests that the Detroit Red Wings did better when Yzerman was out of the lineup. This, obviously, is counterintuitive, since Yzerman is one of the top 40 (or so) players in NHL history.
What's the flaw in this methodology? Let's step back. Yzerman was generally healthy at the start of his career (when the "Dead Things" were a poorly-run franchise). He struggled with injuries late in his career, when the Red Wings were (probably) the best team in the NHL. (More than half of the games that Yzerman missed in his entire career were in 2001 through 2003, ages 35 to 37). Essentially, this method "reads" that Detroit did poorly when Yzerman was healthy, and it did better in the games that Yzerman missed. That conclusion is nonsense, because there isn't a level playing field. When Yzerman was missing lots of games, the Red Wings had Lidstrom, Fedorov, Chelios, Shanahan, etc. This simplistic approach ascribes all of the changes in the team's results to one player's presence.
pnep's methodology avoids these cross-career comparisons. Yzerman played 22 seasons. In 15 of them, he played at least 90% of the games (of which, in 13 of them, he played at least 95% of the games). These 15 games are dropped from the analysis entirely. Detroit's record in the two games that Yzerman missed in 1996 (for example) has no informational value.
pnep's results only consider seasons where a player has missed a meaningful number of games. (There are two tabs - one captures all seasons where a player has missed >10% of the games, and the other captures all seasons where a player missed >20%). Specifically, this captures the 1986, 1988, 1994, 2001, 2002, 2003, and 2006 campaigns.
The simple (unweighted) average shows that Detroit had about a 62% win percentage when Yzerman played, and 59% when he didn't. Even that's somewhat misleading, since it includes his 2006 campaign, when he was finished as a player. (Drop his final, dismal year, and we get a simple average of 61% when Yzerman played vs 56% when he didn't - probably not an unreasonable ballpark estimate of Yzerman's impact).
This isn't a problem limited to Yzerman. Denis Potvin has the exact same pattern - he was generally healthy when the Islanders were an expansion team, but started missing games during the dynasty years, so a simple calculations shows that the Islanders did better when Potvin was sitting out.
Using pnep's approach, there's probably some informational value in looking at a team's record when a player is vs isn't in the lineup. (I intend to go through the details in the spreadsheet, and see if anything interesting comes up).
(The main issue with this approach - sample sizes can be tiny. There are some players who missed almost no games during their primes - Howe, Ovechkin, Horton, etc. There simply isn't a way to calculate a meaningful result for them. Even for players who missed time more frequently - Lemieux, Forsberg, Lindros, etc - the sample sizes are still relatively small, and wonky things can happen).

 tinyurl.com

 tinyurl.com

