By Teams?
Best I can find! Team names are in Russian but its a recent list
Last edited:
By Teams?

| Regular-Season average league attendance Europe & Asia | ||
| 1 | Switzerland - National League | 7,074 |
| 2 | Germany - Deutsche Eishockey Liga | 6,523 |
| 3 | Russia - Kontinental Hockey League | 6,486 |
| 4 | Sweden - Swedish Hockey League | 6,056 |
| 5 | Czech Republic - Extraliga | 5,724 |
| 6 | Finland - Liiga | 4,236 |
| 7 | Austria - EBEL | 3,163 |
| 8 | Great Britain - Elite Ice Hockey League | 3,043 |
| 9 | Slovakia - Extraliga | 2,379 |
| 10 | France - Ligue Magnus | 1,940 |

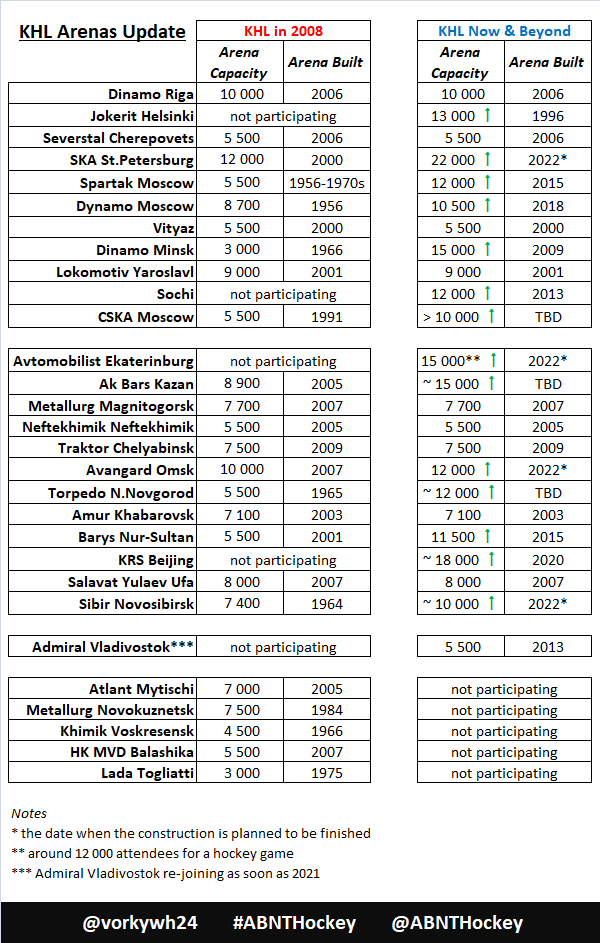
Regarding the KHL & attendance. Some clubs with smaller venues are taking the league´s average down (DEL having the same problem). Too much disparity with arenas´ capacity. But it will be fixed soon when the new venues are finished, see the table below. The "new normal" will be 10-12,000 seats instead of around 6000 seats. No other European hockey league has made such huge progress since the 2010s. The biggest progress is with 10,000+ venues, around 12% in 2008 to 62% in the upcoming future. And, what is very positive, small venues with around 5,000 seats are disappearing. If these clubs stay in the league, there will be just four such venues (5k) comparing to almost 50% in the early days of the league. And if new teams join, especially outside Russia, they will definitely come to the league with big, over 10,000 seats, venues.

Guessing it is just a matter of time when the KHL will be the most attended (on average) league in Europe. Btw, the KHL is now the most attended league in total numbers - around 4,8 million (regular-season 19-20) to around 2,3 million in the second-best league (DEL). And SKA will be the best without any doubt, it is a matter of time.
Edit:
Looks like we can add the city of Ufa to the category of proposed 10,000+ venue. If all goes well, of course.
I would like to see the same, if not better, growth in other European hockey leagues. If I am correct, I just see two venues in Switzerland & Finland, one in DEL.
I should be clear about what I mean. I discussed the development for the last decade. So, construction of 10,000+ venues. In Switzerland, I know about U/C venue in Zurich & Vaudoise Aréna in Lausanne. But, yeah, I admit, I made a mistake, Lausanne´s arena is smaller than 10,000 seats.Third one with 12.000 is one the way, in Zurich.
| Season | Total Teams | Average Attendance | Avg. YoY Change (%) | Total Attendance | Total YoY Change (%) | Epic Facts |
|---|---|---|---|---|---|---|
| 2008/2009 | 24 | 5,117 | N/A | 3,438,742 | N/A | The inaugural season of the KHL, establishing professional hockey across Russia. |
| 2009/2010 | 24 | 5,536 | +8.19% | 3,720,247 | +8.19% | Growth in fanbase with strong performances by top teams. |
| 2010/2011 | 23 | 5,793 | +4.64% | 3,597,102 | -3.31% | Introduction of more competitive teams, leading to increased interest. |
| 2011/2012 | 23 | 5,914 | +2.09% | 3,672,902 | +2.11% | KHL expanded internationally, attracting more global attention. |
| 2012/2013 | 26 | 6,105 | +3.23% | 4,126,725 | +12.36% | The league saw its first major attendance spike, reflecting its growing popularity. |
| 2013/2014 | 28 | 6,080 | -0.41% | 4,596,836 | +11.38% | Despite a slight dip, fan engagement remained strong across the league. |
| 2014/2015 | 28 | 6,422 | +5.63% | 5,395,035 | +17.37% | The KHL All-Star Game boosted fan interest and attendance. |
| 2015/2016 | 28 | 6,300 | -1.90% | 5,292,728 | -1.90% | The KHL continued to expand its reach with more international games. |
| 2016/2017 | 29 | 6,124 | -2.79% | 5,328,314 | +0.67% | An intense season with numerous close games kept fans coming back. |
| 2017/2018 | 27 | 6,232 | +1.76% | 4,711,996 | -11.57% | The KHL celebrated its 10th anniversary with various fan events and promotions. |
| 2018/2019 | 25 | 6,389 | +2.52% | 4,952,107 | +5.10% | One of the most competitive playoff series in KHL history. |
| 2019/2020 | 24 | 6,492 | +1.61% | 4,830,293 | -2.46% | The season was cut short due to the COVID-19 pandemic. |
| 2020/2021 | 23 | 6,073 | -6.45% | 1,383,515 | -71.36% | A challenging year with limited attendance due to the pandemic. |
| 2021/2022 | 24 | 2,348 | -61.33% | 1,343,478 | -2.89% | Strict COVID-19 protocols led to historically low attendance. |
| 2022/2023 | 22 | 5,431 | +131.31% | 4,062,632 | +202.36% | Significant recovery in fan attendance as restrictions eased. |
| 2023/2024 | 23 | 6,622 | +21.93% | 5,178,246 | +27.47% | Record-breaking attendance numbers, highlighting the KHL's growing appeal. |
| Club | Avg. Attendance 2023-2024 | Occupancy Rate (%) | Sellouts | Change from 2022-2023 | Epic Facts |
|---|---|---|---|---|---|
| SKA St. Petersburg | 13,570 | 97.8% | 26 | +7% | Set record with new arena, consistently hitting 20k+ attendance. |
| Dinamo Minsk | 12,057 | 79.9% | 10 | +10% | Strong local support with rising fanbase engagement. |
| Avangard Omsk | 11,702 | 97.4% | 27 | +9.5% | Filled new arena consistently, with high ticket demand. |
| Sibir Novosibirsk | 10,224 | 96.1% | 26 | +10% | New arena brought a surge in attendance, highlighting hockey's popularity in Siberia. |
| Salavat Yulaev Ufa | 7,620 | 89.4% | 16 | +9.3% | Maintains a strong and passionate local following. |
| Traktor Chelyabinsk | 7,347 | 97.8% | 30 | +9.9% | Consistently high occupancy, reflecting deep community ties. |
| Ak Bars Kazan | 7,028 | 84.0% | 4 | -5% | Decline due to venue changes, but remains a fan favorite. |
| Dynamo Moscow | 6,968 | 66.2% | 0 | +7.4% | Loyal fanbase, though no sellouts reported this season. |
| Lokomotiv Yaroslavl | 6,623 | 85.0% | 1 | +8.8% | Gradual increase in attendance due to team success. |
| Metallurg Magnitogorsk | 6,615 | 85.9% | 6 | +9.9% | Stable attendance growth with high occupancy rates. |
| Amur Khabarovsk | 6,575 | 92.6% | 19 | +9.5% | Remote location, but extremely dedicated fanbase. |
| CSKA Moscow | 6,531 | 54.0% | 0 | +8% | Strong team performance but lower occupancy due to venue size. |
| Spartak Moscow | 6,498 | 53.3% | 0 | +6.9% | Historical team with steady fan support, though large arena limits occupancy rate. |
| Barys Nur-Sultan | 5,877 | 50.6% | 0 | +9.6% | Steady growth in Kazakhstan’s hockey interest. |
| Torpedo Nizhny Novgorod | 5,500 | 100% | 34 | +7.8% | Perfect occupancy rate, indicating a need for a larger venue. |
| Lada Togliatti | 5,315 | 88.0% | 11 | +10.2% | High local enthusiasm after team’s return to KHL. |
| Avtomobilist Yekaterinburg | 5,167 | 93.2% | 24 | +10.2% | High growth, reflecting increasing competitiveness. |
| HC Sochi | 4,659 | 42.9% | 0 | +8.8% | Location in a tourist city contributes to varied attendance. |
| Severstal Cherepovets | 4,495 | 81.2% | 9 | +7.3% | Consistent local support in a smaller market. |
| Admiral Vladivostok | 4,411 | 74.6% | 3 | +9.4% | Strong community ties in a remote region. |
| Neftekhimik Nizhnekamsk | 3,217 | 58.5% | 0 | +6.7% | Modest but steady growth in attendance. |
| Vityaz Podolsk | 2,872 | 50.6% | 2 | +7.9% | Small but dedicated fanbase, with some sellouts. |
| Kunlun Red Star | 1,057 | 14.9% | 0 | +8.3% | Struggles with attendance due to geographic challenges. |
Thank you for data. It is undisputable that the KHL is the most attended league in Europe in total numbers. Others are not even close. Even if some people might not like it.So, after 3 straight tough years attendance-wise, KHL has recovered extremely strongly in 2023-4 with record average attendance (despite the regular season becoming much longer). No doubt that multiple new large arenas played a role in that change. Having learnt my lesson of plagiarizing Runet pictures with attendance info, I thereby present you with plagiarized Runet tables with attendance info and AI-added Epic Facts!
KHL Attendance with Total Attendance and Epic Facts
[TABLE=collapse]
[TR]
[TH]Season[/TH]
[TH]Total Teams[/TH]
[TH]Average Attendance[/TH]
[TH]Avg. YoY Change (%)[/TH]
[TH]Total Attendance[/TH]
[TH]Total YoY Change (%)[/TH]
[TH]Epic Facts[/TH]
[/TR]
[TR]
[TD]2008/2009[/TD]
[TD]24[/TD]
[TD]5,117[/TD]
[TD]N/A[/TD]
[TD]3,438,742[/TD]
[TD]N/A[/TD]
[TD]The inaugural season of the KHL, establishing professional hockey across Russia.[/TD]
[/TR]
[TR]
[TD]2009/2010[/TD]
[TD]24[/TD]
[TD]5,536[/TD]
[TD]+8.19%[/TD]
[TD]3,720,247[/TD]
[TD]+8.19%[/TD]
[TD]Growth in fanbase with strong performances by top teams.[/TD]
[/TR]
[TR]
[TD]2010/2011[/TD]
[TD]23[/TD]
[TD]5,793[/TD]
[TD]+4.64%[/TD]
[TD]3,597,102[/TD]
[TD]-3.31%[/TD]
[TD]Introduction of more competitive teams, leading to increased interest.[/TD]
[/TR]
[TR]
[TD]2011/2012[/TD]
[TD]23[/TD]
[TD]5,914[/TD]
[TD]+2.09%[/TD]
[TD]3,672,902[/TD]
[TD]+2.11%[/TD]
[TD]KHL expanded internationally, attracting more global attention.[/TD]
[/TR]
[TR]
[TD]2012/2013[/TD]
[TD]26[/TD]
[TD]6,105[/TD]
[TD]+3.23%[/TD]
[TD]4,126,725[/TD]
[TD]+12.36%[/TD]
[TD]The league saw its first major attendance spike, reflecting its growing popularity.[/TD]
[/TR]
[TR]
[TD]2013/2014[/TD]
[TD]28[/TD]
[TD]6,080[/TD]
[TD]-0.41%[/TD]
[TD]4,596,836[/TD]
[TD]+11.38%[/TD]
[TD]Despite a slight dip, fan engagement remained strong across the league.[/TD]
[/TR]
[TR]
[TD]2014/2015[/TD]
[TD]28[/TD]
[TD]6,422[/TD]
[TD]+5.63%[/TD]
[TD]5,395,035[/TD]
[TD]+17.37%[/TD]
[TD]The KHL All-Star Game boosted fan interest and attendance.[/TD]
[/TR]
[TR]
[TD]2015/2016[/TD]
[TD]28[/TD]
[TD]6,300[/TD]
[TD]-1.90%[/TD]
[TD]5,292,728[/TD]
[TD]-1.90%[/TD]
[TD]The KHL continued to expand its reach with more international games.[/TD]
[/TR]
[TR]
[TD]2016/2017[/TD]
[TD]29[/TD]
[TD]6,124[/TD]
[TD]-2.79%[/TD]
[TD]5,328,314[/TD]
[TD]+0.67%[/TD]
[TD]An intense season with numerous close games kept fans coming back.[/TD]
[/TR]
[TR]
[TD]2017/2018[/TD]
[TD]27[/TD]
[TD]6,232[/TD]
[TD]+1.76%[/TD]
[TD]4,711,996[/TD]
[TD]-11.57%[/TD]
[TD]The KHL celebrated its 10th anniversary with various fan events and promotions.[/TD]
[/TR]
[TR]
[TD]2018/2019[/TD]
[TD]25[/TD]
[TD]6,389[/TD]
[TD]+2.52%[/TD]
[TD]4,952,107[/TD]
[TD]+5.10%[/TD]
[TD]One of the most competitive playoff series in KHL history.[/TD]
[/TR]
[TR]
[TD]2019/2020[/TD]
[TD]24[/TD]
[TD]6,492[/TD]
[TD]+1.61%[/TD]
[TD]4,830,293[/TD]
[TD]-2.46%[/TD]
[TD]The season was cut short due to the COVID-19 pandemic.[/TD]
[/TR]
[TR]
[TD]2020/2021[/TD]
[TD]23[/TD]
[TD]6,073[/TD]
[TD]-6.45%[/TD]
[TD]1,383,515[/TD]
[TD]-71.36%[/TD]
[TD]A challenging year with limited attendance due to the pandemic.[/TD]
[/TR]
[TR]
[TD]2021/2022[/TD]
[TD]24[/TD]
[TD]2,348[/TD]
[TD]-61.33%[/TD]
[TD]1,343,478[/TD]
[TD]-2.89%[/TD]
[TD]Strict COVID-19 protocols led to historically low attendance.[/TD]
[/TR]
[TR]
[TD]2022/2023[/TD]
[TD]22[/TD]
[TD]5,431[/TD]
[TD]+131.31%[/TD]
[TD]4,062,632[/TD]
[TD]+202.36%[/TD]
[TD]Significant recovery in fan attendance as restrictions eased.[/TD]
[/TR]
[TR]
[TD]2023/2024[/TD]
[TD]23[/TD]
[TD]6,622[/TD]
[TD]+21.93%[/TD]
[TD]5,178,246[/TD]
[TD]+27.47%[/TD]
[TD]Record-breaking attendance numbers, highlighting the KHL's growing appeal.[/TD]
[/TR]
[/TABLE]
KHL Attendance Summary (2023-2024)
[TABLE=collapse]
[TR]
[TH]Club[/TH]
[TH]Avg. Attendance 2023-2024[/TH]
[TH]Occupancy Rate (%)[/TH]
[TH]Sellouts[/TH]
[TH]Change from 2022-2023[/TH]
[TH]Epic Facts[/TH]
[/TR]
[TR]
[TD]SKA St. Petersburg[/TD]
[TD]13,570[/TD]
[TD]97.8%[/TD]
[TD]26[/TD]
[TD]+7%[/TD]
[TD]Set record with new arena, consistently hitting 20k+ attendance.[/TD]
[/TR]
[TR]
[TD]Dinamo Minsk[/TD]
[TD]12,057[/TD]
[TD]79.9%[/TD]
[TD]10[/TD]
[TD]+10%[/TD]
[TD]Strong local support with rising fanbase engagement.[/TD]
[/TR]
[TR]
[TD]Avangard Omsk[/TD]
[TD]11,702[/TD]
[TD]97.4%[/TD]
[TD]27[/TD]
[TD]+9.5%[/TD]
[TD]Filled new arena consistently, with high ticket demand.[/TD]
[/TR]
[TR]
[TD]Sibir Novosibirsk[/TD]
[TD]10,224[/TD]
[TD]96.1%[/TD]
[TD]26[/TD]
[TD]+10%[/TD]
[TD]New arena brought a surge in attendance, highlighting hockey's popularity in Siberia.[/TD]
[/TR]
[TR]
[TD]Salavat Yulaev Ufa[/TD]
[TD]7,620[/TD]
[TD]89.4%[/TD]
[TD]16[/TD]
[TD]+9.3%[/TD]
[TD]Maintains a strong and passionate local following.[/TD]
[/TR]
[TR]
[TD]Traktor Chelyabinsk[/TD]
[TD]7,347[/TD]
[TD]97.8%[/TD]
[TD]30[/TD]
[TD]+9.9%[/TD]
[TD]Consistently high occupancy, reflecting deep community ties.[/TD]
[/TR]
[TR]
[TD]Ak Bars Kazan[/TD]
[TD]7,028[/TD]
[TD]84.0%[/TD]
[TD]4[/TD]
[TD]-5%[/TD]
[TD]Decline due to venue changes, but remains a fan favorite.[/TD]
[/TR]
[TR]
[TD]Dynamo Moscow[/TD]
[TD]6,968[/TD]
[TD]66.2%[/TD]
[TD]0[/TD]
[TD]+7.4%[/TD]
[TD]Loyal fanbase, though no sellouts reported this season.[/TD]
[/TR]
[TR]
[TD]Lokomotiv Yaroslavl[/TD]
[TD]6,623[/TD]
[TD]85.0%[/TD]
[TD]1[/TD]
[TD]+8.8%[/TD]
[TD]Gradual increase in attendance due to team success.[/TD]
[/TR]
[TR]
[TD]Metallurg Magnitogorsk[/TD]
[TD]6,615[/TD]
[TD]85.9%[/TD]
[TD]6[/TD]
[TD]+9.9%[/TD]
[TD]Stable attendance growth with high occupancy rates.[/TD]
[/TR]
[TR]
[TD]Amur Khabarovsk[/TD]
[TD]6,575[/TD]
[TD]92.6%[/TD]
[TD]19[/TD]
[TD]+9.5%[/TD]
[TD]Remote location, but extremely dedicated fanbase.[/TD]
[/TR]
[TR]
[TD]CSKA Moscow[/TD]
[TD]6,531[/TD]
[TD]54.0%[/TD]
[TD]0[/TD]
[TD]+8%[/TD]
[TD]Strong team performance but lower occupancy due to venue size.[/TD]
[/TR]
[TR]
[TD]Spartak Moscow[/TD]
[TD]6,498[/TD]
[TD]53.3%[/TD]
[TD]0[/TD]
[TD]+6.9%[/TD]
[TD]Historical team with steady fan support, though large arena limits occupancy rate.[/TD]
[/TR]
[TR]
[TD]Barys Nur-Sultan[/TD]
[TD]5,877[/TD]
[TD]50.6%[/TD]
[TD]0[/TD]
[TD]+9.6%[/TD]
[TD]Steady growth in Kazakhstan’s hockey interest.[/TD]
[/TR]
[TR]
[TD]Torpedo Nizhny Novgorod[/TD]
[TD]5,500[/TD]
[TD]100%[/TD]
[TD]34[/TD]
[TD]+7.8%[/TD]
[TD]Perfect occupancy rate, indicating a need for a larger venue.[/TD]
[/TR]
[TR]
[TD]Lada Togliatti[/TD]
[TD]5,315[/TD]
[TD]88.0%[/TD]
[TD]11[/TD]
[TD]+10.2%[/TD]
[TD]High local enthusiasm after team’s return to KHL.[/TD]
[/TR]
[TR]
[TD]Avtomobilist Yekaterinburg[/TD]
[TD]5,167[/TD]
[TD]93.2%[/TD]
[TD]24[/TD]
[TD]+10.2%[/TD]
[TD]High growth, reflecting increasing competitiveness.[/TD]
[/TR]
[TR]
[TD]HC Sochi[/TD]
[TD]4,659[/TD]
[TD]42.9%[/TD]
[TD]0[/TD]
[TD]+8.8%[/TD]
[TD]Location in a tourist city contributes to varied attendance.[/TD]
[/TR]
[TR]
[TD]Severstal Cherepovets[/TD]
[TD]4,495[/TD]
[TD]81.2%[/TD]
[TD]9[/TD]
[TD]+7.3%[/TD]
[TD]Consistent local support in a smaller market.[/TD]
[/TR]
[TR]
[TD]Admiral Vladivostok[/TD]
[TD]4,411[/TD]
[TD]74.6%[/TD]
[TD]3[/TD]
[TD]+9.4%[/TD]
[TD]Strong community ties in a remote region.[/TD]
[/TR]
[TR]
[TD]Neftekhimik Nizhnekamsk[/TD]
[TD]3,217[/TD]
[TD]58.5%[/TD]
[TD]0[/TD]
[TD]+6.7%[/TD]
[TD]Modest but steady growth in attendance.[/TD]
[/TR]
[TR]
[TD]Vityaz Podolsk[/TD]
[TD]2,872[/TD]
[TD]50.6%[/TD]
[TD]2[/TD]
[TD]+7.9%[/TD]
[TD]Small but dedicated fanbase, with some sellouts.[/TD]
[/TR]
[TR]
[TD]Kunlun Red Star[/TD]
[TD]1,057[/TD]
[TD]14.9%[/TD]
[TD]0[/TD]
[TD]+8.3%[/TD]
[TD]Struggles with attendance due to geographic challenges[/TD]
[/TR]
[/TABLE]
Other details highlighted by the K itself in May:
751,703 people in total attended playoff games, again, a KHL record
9,396 – average gameday attendance for the full 2023/24 season and another all-time record
5,929,949 people attended games in regular season and playoffs combined, the third highest in history
In addition, the KHL’s websites enjoyed a 43% increase in views and a 41% rise in unique visitors. The mobile app saw a 4% boost in unique visitors and a 24% increase in views.
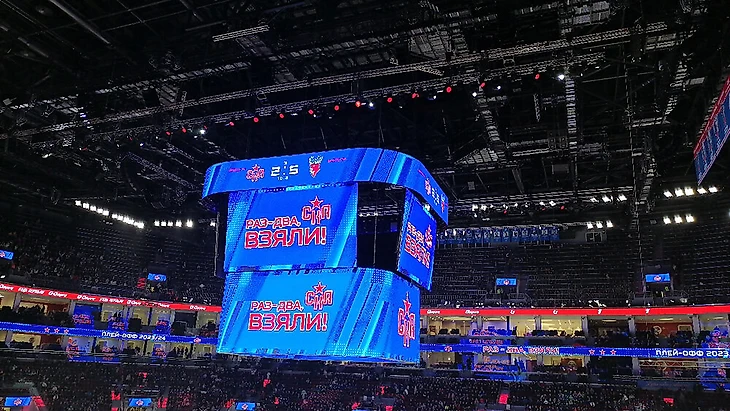
First picture definitely isn't from the playoffs, as SKA didn't play vs. Sochi there. As for the second picture, the score 5:2 was in the last 10 seconds of the game, so the pic was likely taken after the game was over.SKA's record-setting "97.8 % occupancy rate" and "consistent 20k+ attendance" with the upper ring as good as empty even in the playoffs:

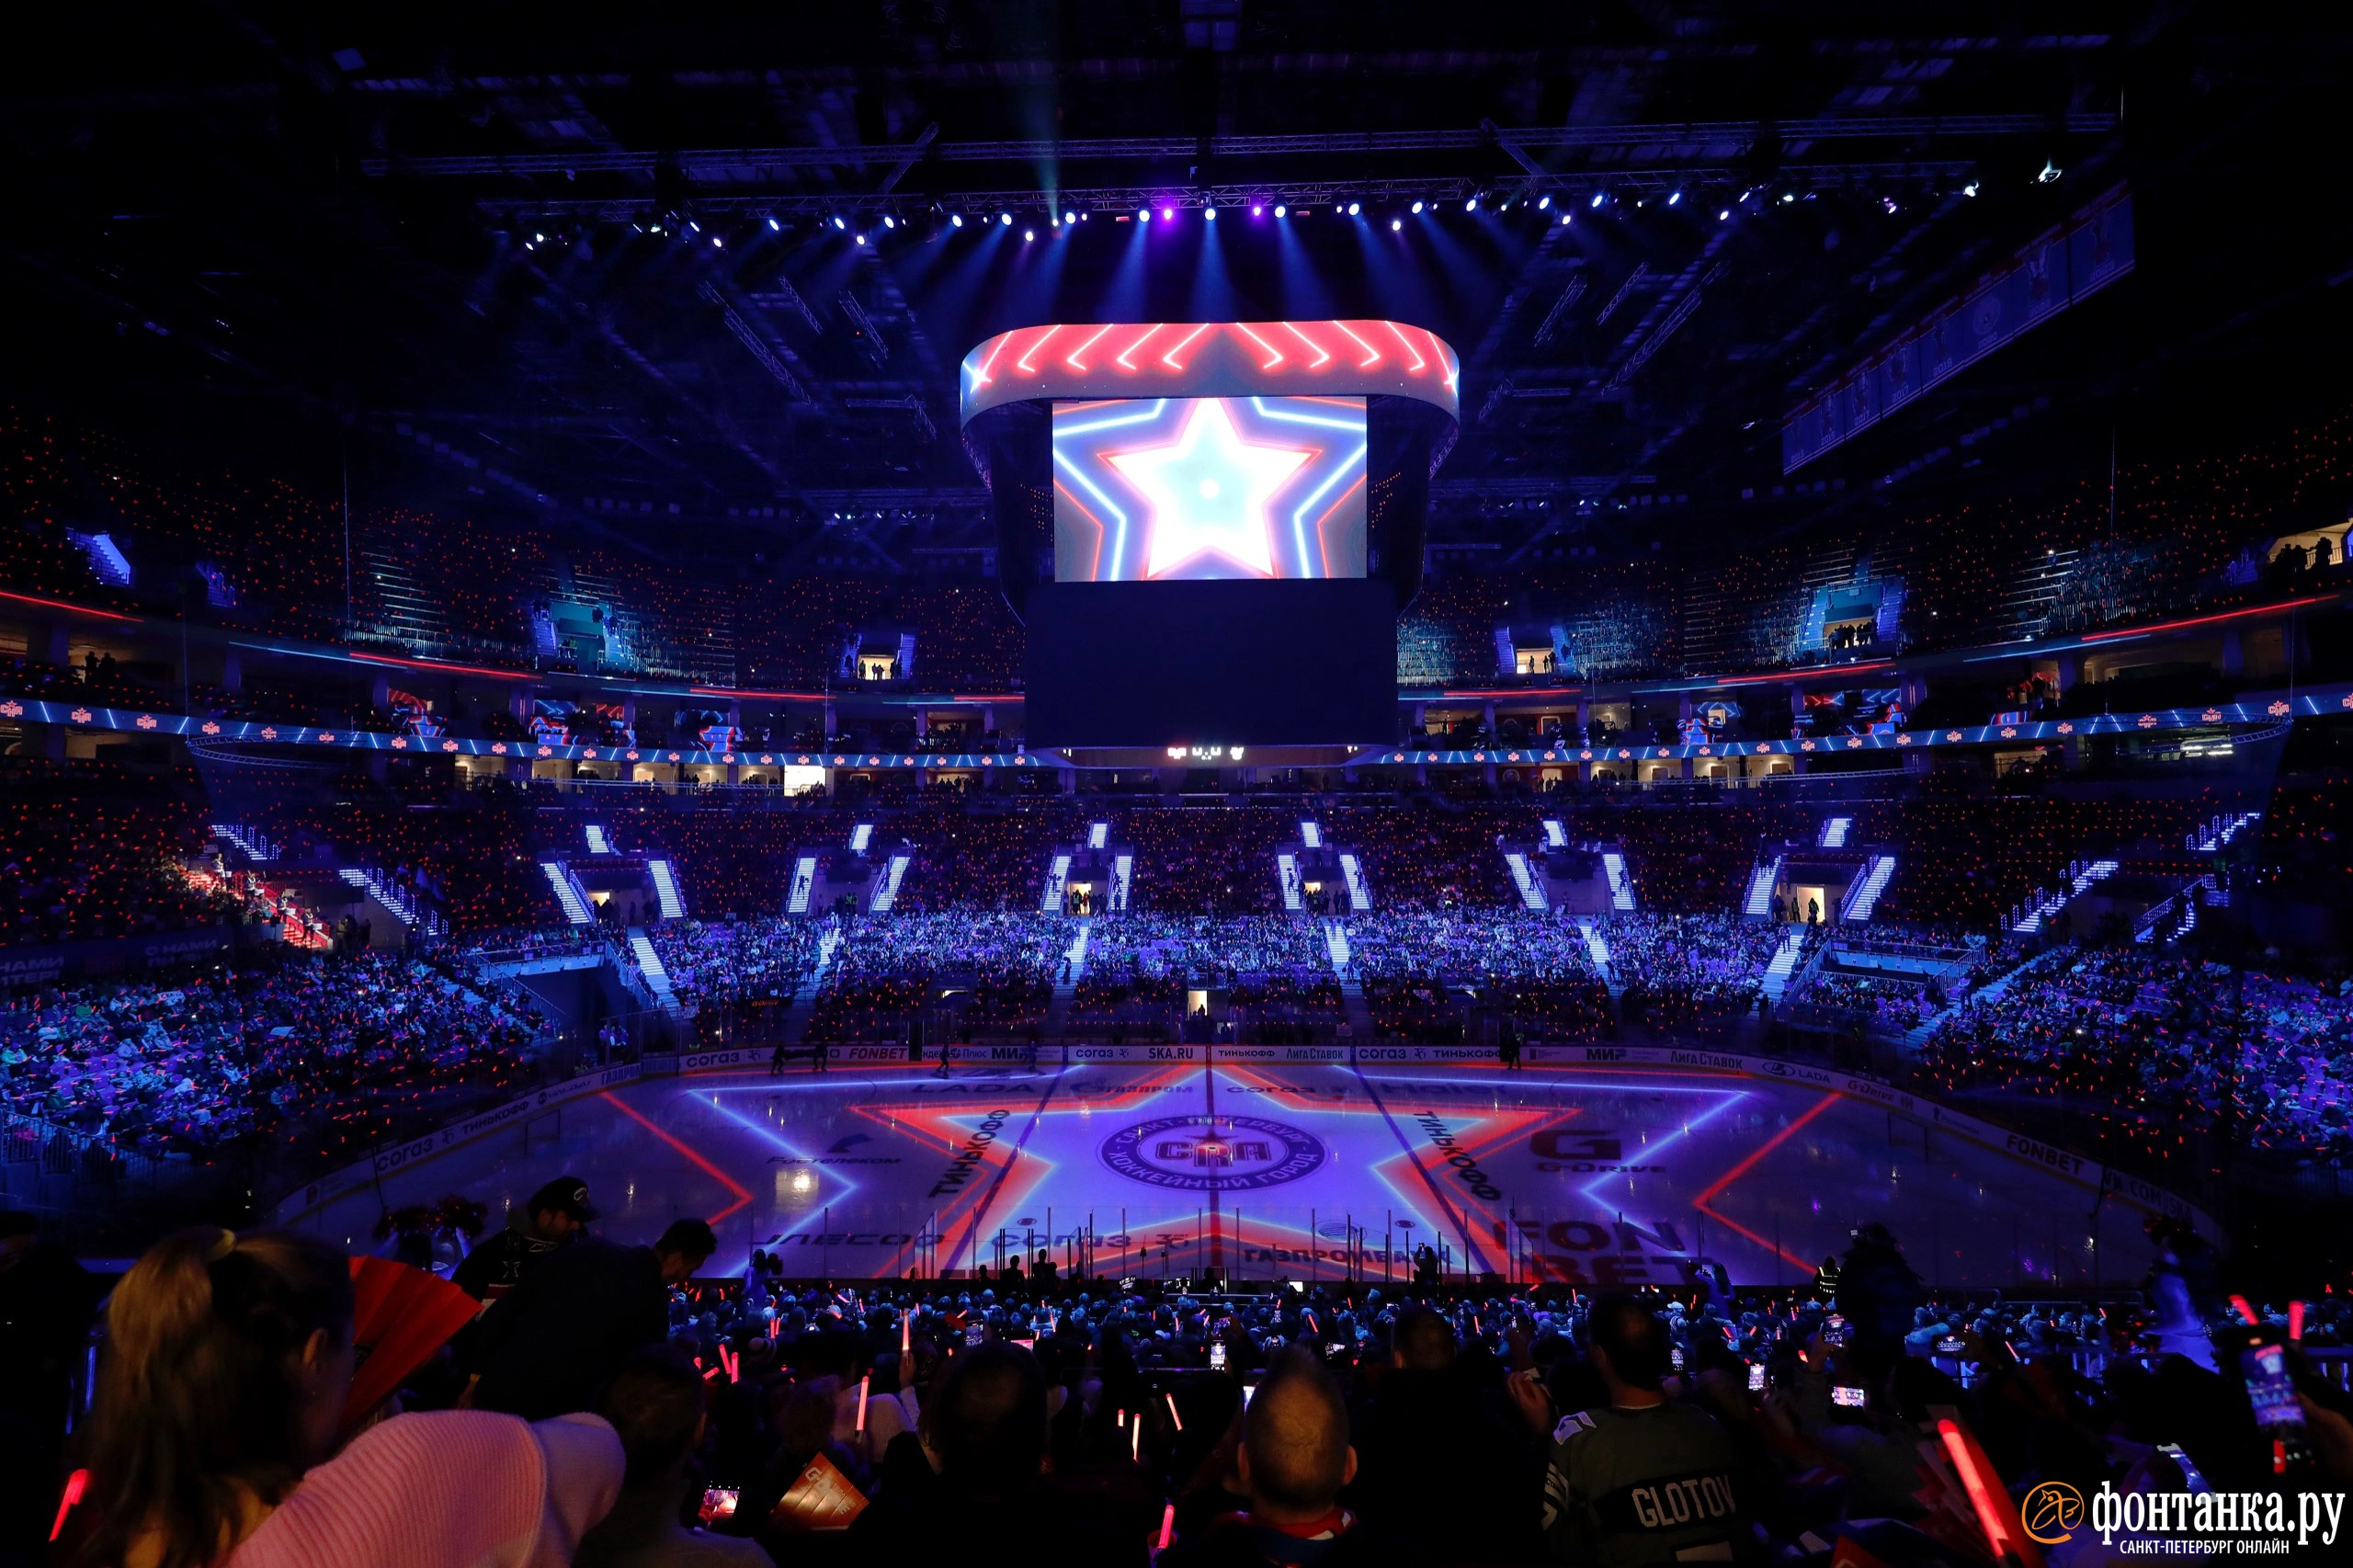
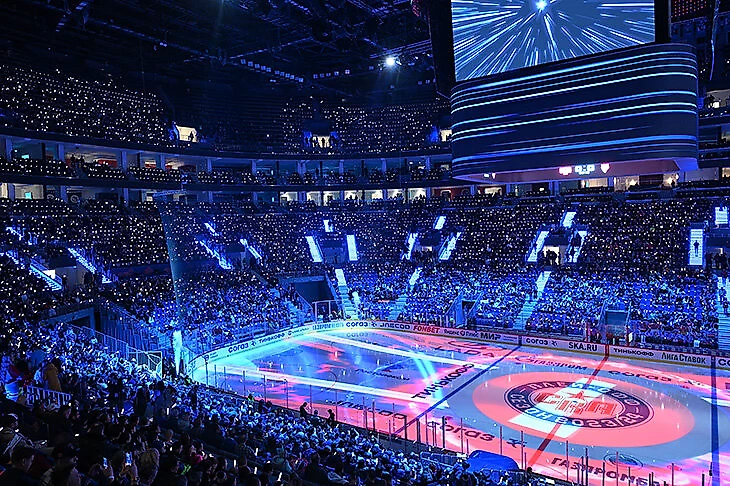
Some other pics from the same games (vs. Sochi and Torpedo respectively) you have selected:SKA's record-setting "97.8 % occupancy rate" and "consistent 20k+ attendance" with the upper ring as good as empty even in the playoffs:


KHL's official fabricated numbers have little to do with reality, if real numbers exist they certainly aren't published.


I guess your Math isn't that much better than the pics selection skill.First game looks like 80 %, second 60 %
 Seriously, 60% is like close to a half-empty arena, where are those large empty sections in the second pic? Maybe behind the cam, then I really admire your telepathy skill.
To start, it is absurd to even suggest that a meaningless game vs. Sochi would be more attended than the first playoff game vs. Torpedo. As for the picture itself, unfortunately it isn't HD, but still I can see some empty seats in the top tier, but other tiers are clearly full or very close to it. So more like 90% at worst to me, unless there's something drastically different on the other side of the cam. Not to mention that I have watched that game on TV live and it could really be felt that the arena is not even close to being half-empty.It's easy to see adjacent empty seats with perfectly aligned white lights. If you want to count them all please do, but there are many.
I guess your Math isn't that much better than the pics selection skill.Seriously, 60% is like close to a half-empty arena, where are those large empty sections in the second pic? Maybe behind the cam, then I really admire your telepathy skill.
There is an issue that, if I understand correctly, season ticket holders will count as attending every game - i.e. they don't count the actual attendance, but the number of tickets sold, however it is obvious that the ones with the season tickets won't be there every game.You can freely have your own estimate, the point anyhow is that they claimed to have only full capacity crowds and that evidently wasn't the case. Not that they need to worry about that anymore after torching their arena.
Plus they count all VIP guests.There is an issue that, if I understand correctly, season ticket holders will count as attending every game - i.e. they don't count the actual attendance, but the number of tickets sold, however it is obvious that the ones with the season tickets won't be there every game.


 ), as uneven as MHL attendance, with AI-added epic facts!
| Rank | Match | Attendance | Date | Epic Fact |
|---|---|---|---|---|
| 1 | Omskie Yastreby vs. MHK Spartak | 10,318 | April 30, 2013 | In the heart of Siberia, where winters are fierce and the people fiercer, Omskie Yastreby, fueled by the unyielding spirit of Omsk, conquered the Kharlamov Cup in front of a legendary crowd that turned the arena into a fortress of victory. |
| 2 | Omskie Yastreby vs. MHK Spartak | 9,970 | April 19, 2013 | Beneath the cold Siberian skies, nearly 10,000 fans gathered, their passion as unrelenting as the vast Russian steppe, driving Omskie Yastreby to the edge of glory. |
| 3 | Omskie Yastreby vs. HK MVD | 9,680 | April 7, 2013 | In the land where the mighty Irtysh River flows, Omskie Yastreby soared above the rest, their triumph echoing across the vast plains of Siberia. |
| 4 | Omskie Yastreby vs. MHK Spartak | 9,450 | April 20, 2013 | Within the steely embrace of Omsk, Omskie Yastreby, driven by the unbreakable will of their fans, clinched a crucial victory, their legacy growing with every roaring cheer. |
| 5 | Omskie Yastreby vs. MHK Spartak | 9,310 | April 29, 2013 | The frozen lands of Omsk bore witness to a comeback for the ages, as Omskie Yastreby, backed by an unyielding legion, turned the tides in their favor. |
| 6 | Sibirskie Snaipery vs. Kuznetskie Medvedi | 9,109 | March 2, 2024 | In the heart of Novosibirsk, where the biting cold meets fiery passion, Sibirskie Snaipery's fans set the arena ablaze with their record-breaking fervor. |
| 7 | Loko vs. Chaika | 9,070 | April 21, 2016 | In the historic city of Yaroslavl, where legends are born, Loko's triumph before a packed arena became the stuff of folklore, forever etched in the annals of Russian hockey. |
| 8 | Omskie Yastreby vs. HK MVD | 8,870 | April 15, 2013 | Once again, the indomitable spirit of Omsk carried Omskie Yastreby to victory, as their fans filled the arena with the echoes of Siberian resilience. |
| 9 | Omskie Yastreby vs. Stalnye Lisy | 8,500 | April 7, 2012 | In a city forged by industry and ice, Omskie Yastreby’s fans unleashed a torrent of support that powered their team to playoff immortality. |
| 10 | Tolpar vs. Omskie Yastreby | 8,250 | March 27, 2010 | Under the shadow of the Ural Mountains, Tolpar stood tall, nearly filling their arena in a defiant display of strength against the might of Omskie Yastreby. |
| 11 | Loko vs. Chaika | 8,170 | April 15, 2016 | In Yaroslavl, a city that has known both triumph and tragedy, Loko’s victory before a sea of fans became a beacon of hope and glory. |
| 12 | Sibirskie Snaipery vs. Irbis | 8,028 | February 24, 2024 | Amidst the vast expanse of Novosibirsk, Sibirskie Snaipery shattered attendance records, their fans’ passion as boundless as the Siberian wilderness. |
Regarding the KHL & attendance. Some clubs with smaller venues are taking the league´s average down (DEL having the same problem). Too much disparity with arenas´ capacity. But it will be fixed soon when the new venues are finished, see the table below. The "new normal" will be 10-12,000 seats instead of around 6000 seats. No other European hockey league has made such huge progress since the 2010s. The biggest progress is with 10,000+ venues, around 12% in 2008 to 62% in the upcoming future. And, what is very positive, small venues with around 5,000 seats are disappearing. If these clubs stay in the league, there will be just four such venues (5k) comparing to almost 50% in the early days of the league. And if new teams join, especially outside Russia, they will definitely come to the league with big, over 10,000 seats, venues.

Guessing it is just a matter of time when the KHL will be the most attended (on average) league in Europe. Btw, the KHL is now the most attended league in total numbers - around 4,8 million (regular-season 19-20) to around 2,3 million in the second-best league (DEL). And SKA will be the best without any doubt, it is a matter of time.
Edit:
Looks like we can add the city of Ufa to the category of proposed 10,000+ venue. If all goes well, of course.
Agree, similar problem can be seen in other leagues, but not in that degree as in KHL & DEL. Agree, leagues should fix that problem as soon as possible. Meaning, construction of new venues with bigger capacity.This the equal in pretty much every league in europe. The top-3 or so teams have large arenas and ~50% of the leage drags the average numbers down. The two teams playing the finals last season in the SHL has 6k and 5k arenas respectively.
