Gompertz functions are (were?) included in the syllabus for actuarial exams though I can't remember actually using them on anything. The form we studied was just a means of interpolating points on a mortality table at different ages. State regulations usually proscribe these things and I think any interpolation used now is just linear. These functions are just particular types of logistic curves which are in general used to model population growth. So he estimated the parameters of his general logistic and wound up with a Gompertz function.
Those YT's are very interesting and Levitt's part in this thing is a
very very fascinating story. Lol, I would watch this Hollywood movie.
")
Supposedly he can prove that Covid-19's growth never was exponential -- like so many assumed it would be. Kind of like a bullet leaving a gun that has a high speed and then the speed decreases linearly due to air resistance (albeit against a lg scale), Covid-19 does the same.
But to start from the beginning. There are a few, not a bunch, of formulas created to model growth in different areas with different logarithmic functions. They pretty much cover the whole field. Some can be used top map the spread of a fire that grows exponentially until it runs out of oxygen and crashes. Others to model how grasshoppers will increase and decrease in its curves. Like in so many other areas, the basics of nature is not super versatile, and patterns in one area are often mirrored in a bunch of others.
So Levitt is not an epidemiologist, but he is a bioscience modelling guru, the modelling guru, and have been working with models like this his whole life. He has a lot of friends in China and when this thing broke out in January he was sitting at home being a little depressed because his wife died fairly recently, he had been alone for Christmas etc, and he started to apply his knowledge to the virus outbreak just for fun. He expected exponential growth and that a model to simulate such a pattern would fit best -- because this is what many epidemiologist used. But it he doesn't get it to fit Covid-19 at all by his high standards of modelling (including the Sigmoid function used by most epidemiologists). So after a while of testing different alternatives he digs up this old
Gompertz function, and tries it just for the fun of it --
and its fit to a T.
Just like a bullet leaving a gun that has a speed that is reducing linearly, the
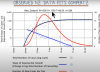
growth of Covid 19 is decreasing linearly (against a lg scale) from day 1. You get a slightly back-heavy peaky curve when looking at cases per day.
The above chart was South Korea, this is New Zeeland.
And its the same, no matter where he looks, Wuhan, Northern Italy, Princess whatever the boat was called, and so forth and so forth.
So for him its like super obvious, all other formulas get crappy result, but when he tried the Gompertz function -- its beautiful. Schoolbook curves. He thinks great, I got a bunch of new examples to use in class. To help his friends, he applies some specifics for Wuhan and calls it a day. Because if you know that the Gompertz model fits, all you need to do is have very early data (that is correct) and you can produce the rest of the curve. For a curve that will follow the Gompertz function, all you need is data on a few weeks of growth and decrease of growth -- and you can produce a curve showing how it will play out exclusive of other new factors coming in.
But then after a weeks when he is leaning back in his, throwing down some old malt products,
he starts to get agitated.
WHAT IS THIS? MAKE MY DAY? Experts, epidemiologists, are on TV, and
THEY GOT IT ALL WRONG. They are talking about exponential growth leading to millions of deaths. The curves and models they are producing are using poor formulas to predict the growth that will produce results that are clearly not in touch with reality -- at all (from his perspective, what do I know). Don't they understand that with Gompertz -- just like the bullet falling from the air landing on the ground -- the curve will go up fast, but also down fast. And as soon as you can see that the growth initally isn't mega fast -- you know that you are not talking about 100% of a population getting seriously ill. It will stop much before that.
So he seeks some attention and tells everyone how it should be, he is a big celebrty in these circles so he also gets pretty much attention, but to his shock -- he finds that nobody of the real experts that are impacting government policy listen to him.
After that he has kind of been on a crusade. One thing is really obvious, when looking at predictions of places reaching Peak Outbreak, and what will happen after it, his predictions are 100x as good as anyone else's. He just nails them. In some cases he obviously had bad input data, and remember, when looking at growth like this -- its essential to isolate a geographical area. If you have 5 different outbreaks occuring at different times, but within the borders of one country, you must have 5 different curves. The curve for this country with outbreaks coming at different times -- can not be modeled with one Gompertz. If that is the case, you must have five Gompertz and add them together.
A tweet showing how frustrated he is: