monitoring_string = "358c248ada348a047a4b9bb27a146148"
2024-25 OFFICIAL HOLLYWOOD TOP 35 | HFBoards - NHL Message Board and Forum for National Hockey League
  • Xenforo Cloud upgraded our forum to XenForo version 2.3.4. This update has created styling issues to our current templates, this is just a temporary look. We will continue to work on clearing up these issues for the next few days and restore the site to it's more familiar look, but please report any other issues you may experience so we can look into. Thanks for your patience and understanding.

2024-25 OFFICIAL HOLLYWOOD TOP 35

Hollywood3

Bison/Jet/Moose Fan
OFFICIAL HOLLYWOOD TOP 35 ~ 2024-25 ~ POLL 1 ~ SEPTEMBER 22, 2024

The games played column is beginning to get a workout, so it’s time for the first OHT35 of the season. For most teams there is one more week of exhibition play before the regular season starts.

NOTE: This is NOT a ranking. The results have just been entered onto the tables I intend to use this year.

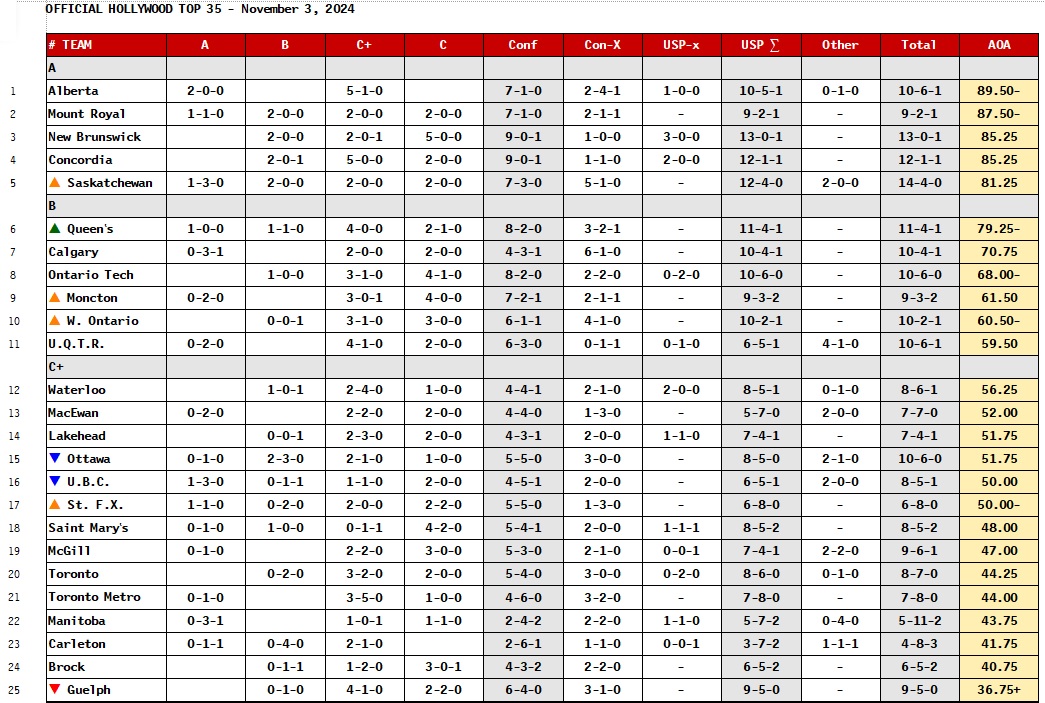
24-09-22-OHT35-table1.jpg

24-09-22-OHT35-table2.jpg

24-09-22-OHT35-table345.jpg


* indicates total includes a tie game
Conf. indicates overall conference record
Conf-x indicates exhibition record within conference
USP-x indicates exhibition record within USports but outside conference
USP ∑ indicates regular season and exhibition record against USports teams
Other indicates record against non-USports teams
Total indicates record against all teams
AOA is the average of averages against each category of opponent.
~ Indicates results “smoothed” to reduce impact of categories with fewer games. The categories are merged and the value applied to both.
 
  • Like
Reactions: Rob
OFFICIAL HOLLYWOOD TOP 35 ~ 2024-25 ~ POLL 2 ~ SEPTEMBER 29, 2024

The pre-season component of the exhibition/non-conference portion of the season has wrapped up this weekend. I have assigned a preliminary grade for each team.

NOTE: This is NOT a ranking. The teams are sorted by their preliminary grade then alphabetically by conference. From the end of last season, the changes are:

CW: Alberta drops from B to C+, Manitoba is up from C- to C+.

OUA West: Brock drops from B to C+, Guelph is up from C to C+, and Waterloo and Western Ontario are up from C- to C+.

OUA East: Carleton is up from C to C+, and RMC and York are up from C- to C.

AUS: Acadia and UPEI are up from C to C+, St. FX is down from C+ to C, and Dalhousie is up from C- to C.

24-09-29-OHT35-table1.jpg

24-09-29-OHT35-table2.jpg

24-09-29-OHT35-table345.jpg


* indicates total includes a tie game
Conf. indicates overall conference record
Conf-x indicates exhibition record within conference
USP-x indicates exhibition record within USports but outside conference
USP ∑ indicates regular season and exhibition record against USports teams
Other indicates record against non-USports teams
Total indicates record against all teams
AOA is the average of averages against each category of opponent.
~ Indicates results “smoothed” to reduce impact of categories with fewer games. The categories are merged and the value applied to both.
 
Last edited:
Not sure why in your tables that the AUS can be 6-3-1 vs. the OUA, but the OUA is 4-5-1 vs. the AUS? Shouldn't it be 3-6-1 or am I missing something?
 
OFFICIAL HOLLYWOOD TOP 35 ~ 2024-25 ~ POLL 3 ~ OCTOBER 6, 2024

This is the first ranking, since all but Manitoba opened their regular season last weekend. Nobody shifted (yet) but shifts are quite likely in the next week or two. (FWIW, shifts from C to C- or vice versa do not affect the rankings so I’m not making note of those.)
24-10-06-OHT35-table1.jpg

24-10-06-OHT35-table2.jpg

24-10-06-OHT35-table345.jpg


* indicates total includes a tie game
Conf. indicates overall conference record
Conf-x indicates exhibition record within conference
USP-x indicates exhibition record within USports but outside conference
USP ∑ indicates regular season and exhibition record against USports teams
Other indicates record against non-USports teams
Total indicates record against all teams
AOA is the average of averages against each category of opponent.
~ Indicates results “smoothed” to reduce impact of categories with fewer games. The categories are merged and the value applied to both.
 
OFFICIAL HOLLYWOOD TOP 35 ~ 2024-25 ~ POLL 4 ~ OCTOBER 13, 2024

Only one team got shifted - namely Alberta moving back to B from C+. In fact, their AOA would warrant a further promotion to A, along with Sask and MRU. In the CW, it is now UBC who deserve a relegation. The reigning CW champions were 4-0-0 in pre-season, but that was against Trinity and Simon Fraser. Their 0-3-1 against Calgary and MRU is not all inconsistent with that preseason record.

FWIW, the default value AOA for each category is:
A 81.50
B 63.50
C+ 47.00
C 29.00

There are a lot of teams ready to shift categories after being assigned one based on pre-season. (To be fair, not many teams have significant differences between their pre-season and regular season records.) Right now, one oddball result can change a team’s AOA but lots. I will blend in the pre-season records to a minor extent to increase sample size.

24-10-13-OHT35-table1.jpg

24-10-13-OHT35-table2.jpg

24-10-13-OHT35-table345.jpg


* indicates total includes a tie game
Conf. indicates overall conference record
Conf-x indicates exhibition record within conference
USP-x indicates exhibition record within USports but outside conference
USP ∑ indicates regular season and exhibition record against USports teams
Other indicates record against non-USports teams
Total indicates record against all teams
AOA is the average of averages against each category of opponent.
~ Indicates results “smoothed” to reduce impact of categories with fewer games. The categories are merged and the value applied to both.
 
Last edited:
OFFICIAL HOLLYWOOD TOP 35 ~ 2024-25 ~ POLL 5 ~ OCTOBER 20, 2024

I am a few days late with this poll, but here it is. A major revamp is due with loads of teams deserving to rise or fall a category. Look for major shifts next week.

24-10-20-OHT35-table1.jpg

24-10-20-OHT35-table2.jpg

24-10-20-OHT35-table345.jpg


* indicates total includes a tie game
Conf. indicates overall conference record
Conf-x indicates exhibition record within conference
USP-x indicates exhibition record within USports but outside conference
USP ∑ indicates regular season and exhibition record against USports teams
Other indicates record against non-USports teams
Total indicates record against all teams
AOA is the average of averages against each category of opponent.
~ Indicates results “smoothed” to reduce impact of categories with fewer games. The categories are merged and the value applied to both.
 
OFFICIAL HOLLYWOOD TOP 35 ~ 2024-25 ~ POLL 6 ~ OCTOBER 27, 2024

This was the major turnabout weekend. Concordia, MRU, and Alberta all jumped from B to A, and Queen’s jumped from C+ to B (with a record which could cause a further jump to A next time). Ontario Tech made the jump to B, and MacEwan to C+. Queen’s had the biggest jump in points due to their wins, and the general rise of the OUA East.

UNB’s loss had a ripple effect, as they fell all the way to 3rd!

McGill fell from B to C+, and are in danger of a further drop to C next time. St. FX made a big jump in points due to their win over UNB, so they have another week in the bullpen to make the jump to C+. Laurier continues to be close to a C+ but not quite yet.

Factoring in the pre-season (which went a long way to the initial categories) has only a minor effect. I ran sample numbers for the CW and OUA East and very few teams had a change, and none to their overall category. The points marked with a “+” could rise and those marked with a “-“ could fall with the exhibition records.

The AUS is surprising. Nobody can put back-to-back successful weeks together so as to get a team into the B level. We could easily see Dal in the C, UNB in the A, and the rest in C+ all season long.

24-10-27-OHT35-table1.jpg

24-10-27-OHT35-table2.jpg

24-10-27-OHT35-table345.jpg


* indicates total includes a tie game
Conf. indicates overall conference record
Conf-x indicates exhibition record within conference
USP-x indicates exhibition record within USports but outside conference
USP ∑ indicates regular season and exhibition record against USports teams
Other indicates record against non-USports teams
Total indicates record against all teams
AOA is the average of averages against each category of opponent.
~ Indicates results “smoothed” to reduce impact of categories with fewer games. The categories are merged and the value applied to both.
 
OFFICIAL HOLLYWOOD TOP 35 ~ 2024-25 ~ POLL 7 ~ NOVEMBER 3, 2024

A lot of promotions this week, and an AUS shake-up.

Moncton finally got a boost from C+ to B, and UPEI finally fell from C+ to C. Acadia’s points then took a hit, relegating them to C after teetering for a while. We’ll have to wait to see if that massive C+ category reformulates itself. It seems that the more games these mid-pack teams play, the closer their records become. (By that I mean everybody other than UNB and Dalhousie.)

The CW’s B category shrunk, with Sask getting a boost to A and UBC falling to C+. Both had been teetering. I tend to think that having three A level teams is an anomaly.

In the OUA East, Ottawa’s losing streak has them falling to C+. Not so long ago they were teetering on a promotion to A. After beating UQTR on October 18th, they have lost to UQTR, Queen’s, McGill, and Concordia. Good opponents, but four losses is a major losing streak.

The OUA West saw Western Ontario break through from C+ to B, and this seemed to ripple throughout the division. Six of ten are at C+, and Laurier could join them to make it a lucky seven.

All-in-all, the skew has more teams in A and B (11) than in C and C- (10).

The points marked with a “+” could rise and those marked with a “-“ could fall with the exhibition records.

24-11-03-OHT35-table1.jpg

24-11-03-OHT35-table2.jpg

24-11-03-OHT35-table345.jpg


* indicates total includes a tie game
Conf. indicates overall conference record
Conf-x indicates exhibition record within conference
USP-x indicates exhibition record within USports but outside conference
USP ∑ indicates regular season and exhibition record against USports teams
Other indicates record against non-USports teams
Total indicates record against all teams
AOA is the average of averages against each category of opponent.
~ Indicates results “smoothed” to reduce impact of categories with fewer games. The categories are merged and the value applied to both.
 
OFFICIAL HOLLYWOOD TOP 35 ~ 2024-25 ~ POLL 8 ~ NOVEMBER 10, 2024

Poppy-73px-1.jpg


The OUA West suffered from the domino effect. One team slumps, then that drags down a large part of the division in short order. Waterloo and Guelph stumbled into C level, and Brock and TMU are barely hanging on to the C+ level. This is a situation where one side picking up some major wins could “lift all boats”. Since this division is 8-17 against the OUA East, its teams are very sensitive to tumble together in the rankings.

Otherwise, UBC returned to B and Acadia returned to C+. Meanwhile UQTR is in danger of relegation to C+ next week, and Queen’s and Calgary could be move into A.

The points marked with a “+” could rise and those marked with a “-“ could fall with the exhibition records.

24-11-10-OHT35-table1.jpg

24-11-10-OHT35-table2.jpg

24-11-10-OHT35-table345.jpg


* indicates total includes a tie game
Conf. indicates overall conference record
Conf-x indicates exhibition record within conference
USP-x indicates exhibition record within USports but outside conference
USP ∑ indicates regular season and exhibition record against USports teams
Other indicates record against non-USports teams
Total indicates record against all teams
AOA is the average of averages against each category of opponent.
~ Indicates results “smoothed” to reduce impact of categories with fewer games. The categories are merged and the value applied to both.
 
OFFICIAL HOLLYWOOD TOP 35 ~ 2024-25 ~ POLL 9 ~ NOVEMBER 17, 2024

The only category shift of the week was by Ottawa, returning to B after a sojourn in the C+ group. The rest of the B level could experience a big shift soon. Queen’s could vault into the A level, but UQTR, Moncton, and Western Ontario could be reclassified as C+.

If Western Ontario falls, there would be no OUA West teams above a C+.

In the CW, it looks like the Tier 1 teams (the top five) will eventually move to .500 against one another once there are more GPS. If so, the likelihood is that they all would be at B level.

It also looks like nobody in the middle of the AUS will break away from the pack. It could be said that Moncton, St. FX, Saint Mary’s, and Acadia are all C+ teams.

The exhibition records are losing impact on rankings each week. The points marked with a “+” would rise and those marked with a “-“ would fall with the exhibition records, even when weighted at one-half of the regular season records.

24-11-17-OHT35-table1.jpg

24-11-17-OHT35-table2.jpg

24-11-17-OHT35-table345.jpg


* indicates total includes a tie game
Conf. indicates overall conference record
Conf-x indicates exhibition record within conference
USP-x indicates exhibition record within USports but outside conference
USP ∑ indicates regular season and exhibition record against USports teams
Other indicates record against non-USports teams
Total indicates record against all teams
AOA is the average of averages against each category of opponent.
~ Indicates results “smoothed” to reduce impact of categories with fewer games. The categories are merged and the value applied to both.
 
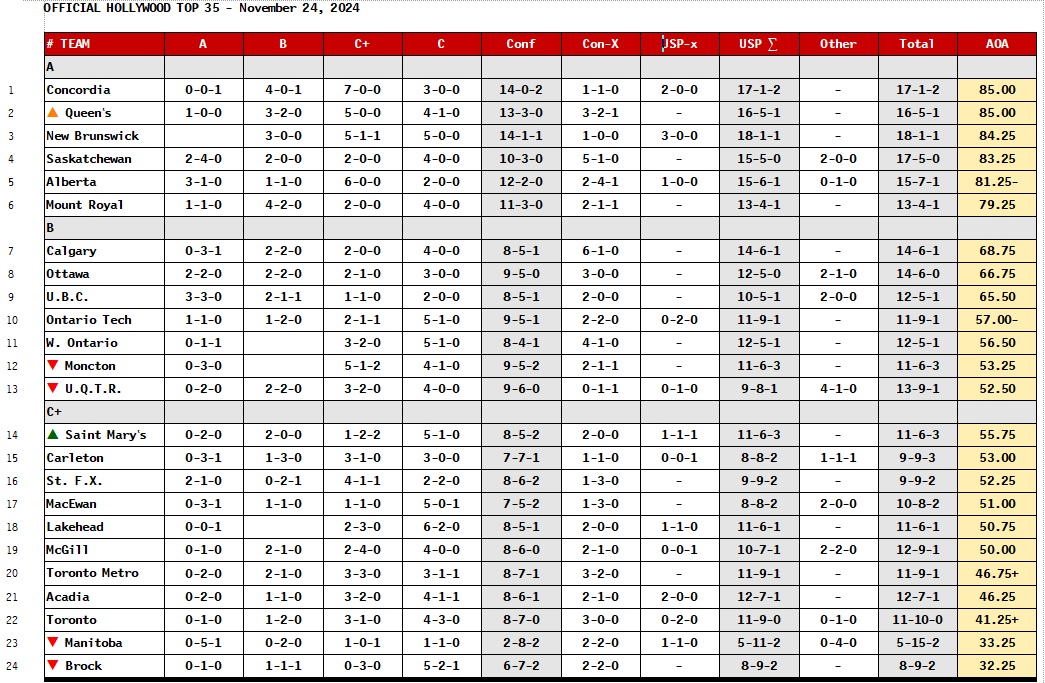
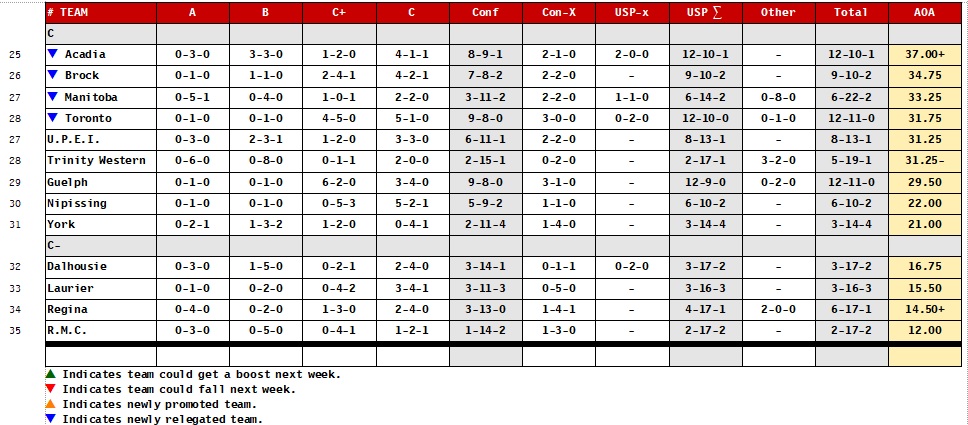
OFFICIAL HOLLYWOOD TOP 35 ~ 2024-25 ~ POLL 10 ~ NOVEMBER 24, 2024

Queen’s made the jump from B to A and otherwise we just have several teams teetering. A big adjustment is in the offing, likely during the semester break. A lot of records (particularly in the OUA West) will need “smoothing” because they often have just one game against A or B teams.

24-11-24-OHT35-table1.jpg

24-11-24-OHT35-table2.jpg

24-11-24-OHT35-table345.jpg


* indicates total includes a tie game
Conf. indicates overall conference record
Conf-x indicates exhibition record within conference
USP-x indicates exhibition record within USports but outside conference
USP ∑ indicates regular season and exhibition record against USports teams
Other indicates record against non-USports teams
Total indicates record against all teams
AOA is the average of averages against each category of opponent.
~ Indicates results “smoothed” to reduce impact of categories with fewer games. The categories are merged and the value applied to both.
 
How in the world does Manitoba (5-11-2 U SPORTS record) or Trinity Western (2-13-1) rank ahead of Guelph (11-9-0)?
A few years back I started using the "average of averages". Against each level of opponent, Guelph is:

v A 0
v B 0
v C+ 62
v C 50
AOA 28.00

Manitoba is:
v A 8
v B 0
v C+ 75
v C 50
AOA 33.25

The mid-point for each level is:
A 81.50
B 63.50
C+ 47.00
C 29.00

When teams have a good or a bad weekend to generate a new AOA which would warrant a shift up or down, they generally "stay put" for at least one more week.
 
OFFICIAL HOLLYWOOD TOP 35 ~ 2024-25 ~ POLL 11 ~ DECEMBER 1, 2024

The OUA West was the big mover this week, with Waterloo and Windsor moving from C to C+. This shifted the numbers throughout the rest of the OUAW, and a little bit in the OUAE as well. There are now a lot fewer teams “hovering” between categories. The Top Ten are all solid. For possible relegations, UQTR, Moncton, and Western Ontario are all hovering to drop down from B to C+, and Manitoba from C+ to C. The only hovering promotions are Carleton, St. FX, and Saint Mary’s close to a jump from C+ to B.

The upcoming week is only a partial week as the first semester comes to an end.

24-12-01-OHT35-table1.jpg

24-12-01-OHT35-table2.jpg

24-12-01-OHT35-table345.jpg


* indicates total includes a tie game
Conf. indicates overall conference record
Conf-x indicates exhibition record within conference
USP-x indicates exhibition record within USports but outside conference
USP ∑ indicates regular season and exhibition record against USports teams
Other indicates record against non-USports teams
Total indicates record against all teams
AOA is the average of averages against each category of opponent.
~ Indicates results “smoothed” to reduce impact of categories with fewer games. The categories are merged and the value applied to both.
 
I'm sorry, Queen's ahead of UNB? :sarcasm: I know you're following your algorithm. but that makes no sense. Even USports' broken system has Queen's at 4th, behind UNB, Concordia and UBC.
 
OFFICIAL HOLLYWOOD TOP 35 ~ 2024-25 ~ POLL 12 ~ JANUARY 5, 2025

This includes all of the holiday games, and the CW’s return to near-regularity last weekend.

I did a major revamp, with all but one side (Moncton) being ranked and classified by their AOA. Moncton and St. FX have identical records and strength of schedule, hence belong in the same tier.

There were more relegations than promotions. St. FX and Carleton both jumped from C+ to B. As noted, St. FX’s B status allowed Moncton to stay put.

Going the other way, UQTR and Western Ontario moved down after weeks of threatening. Of note, UQTR is fattening up on C level teams, going 6-0-0. They are just 4-7-0 against the rest.

Meanwhile, Acadia, Brock, Manitoba, and Toronto all were bumped into the C level. Acadia seem destined to be the team which messes up my calculations this year.

25-01-05-OHT35-table1.jpg

25-01-05-OHT35-table2.jpg

25-01-05-OHT35-table345.jpg


* indicates total includes a tie game
Conf. indicates overall conference record
Conf-x indicates exhibition record within conference
USP-x indicates exhibition record within USports but outside conference
USP ∑ indicates regular season and exhibition record against USports teams
Other indicates record against non-USports teams
Total indicates record against all teams
AOA is the average of averages against each category of opponent.
~ Indicates results “smoothed” to reduce impact of categories with fewer games. The categories are merged and the value applied to both.
 
I'm sorry, Queen's ahead of UNB? :sarcasm: I know you're following your algorithm. but that makes no sense. Even USports' broken system has Queen's at 4th, behind UNB, Concordia and UBC.
I usually look into the "smoothing" option when a team has just one game within a category, and may do so with Queen's. There was a big update this time, though. If that were done, Queen's would be 75% against both A and B, for an average of 82.5%. They would fall to 4th. Concordia also has one A game (an OTL) which makes their AOA look "normal".

I would also say that the USports ranking of UBC is out of line. McGill and UQTR are also way out of line. Despite the OUA East having a good year, both of those teams are sub-.500 against C+ and above competition.
 

Ad

Upcoming events

Ad

Top
-->->