SV% is a team stat far more than an individual one | HFBoards - NHL Message Board and Forum for National Hockey League

SV% is a team stat far more than an individual one

Anglesmith

Setting up the play?
Sep 17, 2012
46,559
15,646
Victoria
Every sports fan loves statistics, and using statistics to assess players is convenient and easy, especially given that no one can watch every game from every team.

But we've had some examples of teams with horrific team save percentages in recent years with clear and obvious causes from the play of the team, and I notice that no matter what the team is doing, the majority of the hockey community seems convinced that a goalie's stats should be assessed in isolation: a goalie with a .914 on a top defensive team is simply better than one with a .885 and that's the end of the story.

I think this flies in the face of two main things: first of all, it's at odds with the fact that we all know that team defence impacts the quality of shots faced by the goalie, yet we minimize this when actually assessing goalies, and second of all there are a huge number of case studies showing the same goalie having drastically different stats in different environments as well as multiple goalies having the exact same struggles on a particular team.

Teams like Calgary last year and Edmonton this year play a high pressure puck retrieval defensive game which relies on winning individual races and battles. This leads to not allowing the other team very much possession, but also means that breakdowns lead to extremely dangerous chances. Goalies face around low-20s shots per game while facing far more dangerous chances than their opposition... a perfect recipe for a low save percentage. And as a result, every goalie playing for those teams gets victimized.

Expected goals models provide expectation values based on each shot location, and assumes that each shot will be defended in a league average way. When a team doesn't defend the dangerous areas effectively, the expected goals is unaffected, but the outcome certainly is.

We see teams like Vegas and the Islanders who can plug anyone in and get good goalie stats, and we see examples like Korpisalo and Talbot trading spots and also trading stats.

So in the face of all of this, why do we still throw goalies under the bus based on SV% and ignore the actual root of the problem?

Of course there is good goaltending and bad goaltending, but the fairest way to assess that is by actually analyzing the goals.
 
Two goalies playing on the same team can have vastly different save percentages.
Of course, but if we're talking about a 1a/1b kind of situation that almost always evens out over the long run (the Leafs this year are a great example).

If you have a backup exclusively playing in back to back situations you get what you expect.
 
I remember when Varly was playing behind some trash Av defenses during the rebuild years, and some people thought his high save percentage was a result of facing tons of shots. He deserved more credit than he received. Those Avs defenses did not manufacture Varly’s numbers.

But there’s definitely merit to it for average goalies. Put them in a good situation, they’ll give you a .910. The opposite, an .890. Why anybody is willing to pay big money to a non-Vezina caliber guy is totally beyond me.
 
SV% can be heavily intertwined with team play. It can also be highly independent of team play.

Ive seen goalies let in supersoft goals and ive seen goalies be completely hung out to dry by their teams.
 
  • Like
Reactions: Ted Hoffman
I think it’s more affected by the team than some give it credit for but it’s definitely an individual stat first. The team can certainly limit shooting from weak areas and channel play to strong area. In addition yes a disproportionate amount of high danger chances will affect s% but over a large sample size it’ll be by .009 in terms of magnitude not .02. It’s like everything you need to compare appropriately by measuring goalie performance against peers with similar performing D.

S% is definitely a better measure than GAA or wins. I charted it a looong time ago when at my most nerdy, looking at the tracking of s% and it’s impact on wins Vs GAA. I did it over a couple of hundred games charting how it affected the results of the teams the goalies played for (which kind of removed the high danger chance disparity as I only tracked it for games I attended). Unsurprisingly s% was far better than GAA for predi outcomes which at the time got treated like the gold standard stat and it annoyed me. There was also a trend on how in the different tiers of teams that s% was a better indicator of performance when moving between tiers (transferring between better or worse teams). GAA had little correlation in this regard.

Unfortunately the breakdown was on a 3 1/4 disk which is a media half the posters on here will never have heard of LOL. As such I can’t dig it out and detail the findings in any meaningful way, so given my vagueness I’m not expecting anyone to buy it. It was 25 years ago… I feel old.
 
  • Like
Reactions: VILARGOD
Lies, damn lies, and stats, right?

What's a game winning goal? A goal scored in OT, that's a game winner. Late in the 3rd of a tie game? Strong argument for a game winner. The 2nd goal in a 7-1 win when you were up 7-0? Not a game winner. Could make the case that the EN goal with 12 sec left in a 6-4 win was the game winner, and not the 5th goal.

40 goal scorer. Get 40 goals in 82 games, you're a 40 goal scorer. That's a 50/50 chance to score in any game. However, you may not have scored those 40 goals in half the games. Might've scored 10 of them in 3. That leaves 30g in 79 games. Not as impressive.

Is the best team the one with the most pts in 82 games, or the the one that got to 16 wins within 28 possible playoff games the quickest? What if you're in a not great division? What if you play the 4 worst possible teams you can in the run to the Cup?
 
I remember when Varly was playing behind some trash Av defenses during the rebuild years, and some people thought his high save percentage was a result of facing tons of shots. He deserved more credit than he received. Those Avs defenses did not manufacture Varly’s numbers.

But there’s definitely merit to it for average goalies. Put them in a good situation, they’ll give you a .910. The opposite, an .890. Why anybody is willing to pay big money to a non-Vezina caliber guy is totally beyond me.

Ask Ken Holland lol
 
  • Like
Reactions: tucker3434
I think it’s more affected by the team than some give it credit for but it’s definitely an individual stat first. The team can certainly limit shooting from weak areas and channel play to strong area. In addition yes a disproportionate amount of high danger chances will affect s% but over a large sample size it’ll be by .009 in terms of magnitude not .02. It’s like everything you need to compare appropriately by measuring goalie performance against peers with similar performing D.
At the end of the day this is exactly what I'm disagreeing with, and I think there is plenty of evidence to that effect.

Of course a goalie actually letting in softies regularly is the biggest factor, but most goalies who maintain their jobs aren't that, and the swings on SV% are huge.

Team defence really brackets goalies into tiers of possible SV% IMO. Last year the Flames typically allowed fewer than 30 shots but gave up at least three that you wouldn't expect any goalie to save. And then there were still chances where you expect some of them to go in (tricky deflections etc.). So it literally wouldn't be right to expect SV% to exceed .900.

But what happened with the majority of fans is that they started analyzing the goals based on the save percentage. Goals that weren't bad goals at all were looked at that way because the save percentage was low, so clearly the goalie needed to save more shots. And I hear this league wide: "it's not just about saving the easy ones, you need your goalies to steal some." The reality is not all teams do.

You have teams who do a great job protecting the slot and preventing odd man rushes (the same Flames team a year prior) and only put their goalie in an out of control situation once or twice a game. They can let in both of these and still maintain good stats and help the team win. The exact same goalie (as the evidence shows) sees wildly different results between the two situations and everything in between.
 
Last edited:
This is 100% true. Bottom line is that strong shot suppression defensive teams actually deflate sv%. This cannot be denied.

If you accumulate all low shot volume games and calculate team SV% that number will always be lower.

I typically like to use 30 and more as high shot volume. You can set whatever parameters you want. The effect is always the same.

Brodeur and Quick have had cumulatively deflated SV%'s while guys like Luongo and Hasek have had cumulatively inflated SV%'s.
 
  • Like
Reactions: Great Panda 2
I like GSAx more than raw save %.

Goals Saved Above Expected Leaders (2007-2022)

Goals Saved Above Expected Leaders (2023)

How is GSAx calculated?

xG as a descriptive model:

But we can also determine how much better than average the shooting was (GAx = GF – xGF) and how much better than average the goal-tending was (GSAx = xGA – GA).
I have found that GSAx still punishes goalies who face low volume and are not well protected by defence. For example, shots from the centre of the slot might have an expectation of 0.2 or something, because you expect that each game there will be several attempts with varying degrees of situational danger.

When teams give up one or two chances from there and don't contest them effectively, the true expectation for those particular shots might be much closer to one.

Happened a lot last year. We had a poster who would always appeal to GSAx at the end of every game, and it would be like "which of these goals would you actually expect to be saved?" and the answer was generally "that's not the point."

For sure. There are always what ifs with these stats. You can't just take any one stat at face value, without nuance. I find it slightly better than raw Save %. It is still telling when Price is first on the list by far and was protected by a dumpster fire his whole career. Lines up perfectly with the eye test, international results and all of his piers consistently namely him the best goalie in the NHL even when his raw save % wasn't the highest.

Ya, using GSAx over one game sample sizes is borderline trolling. I find it better on aggregate over a longer period of time. Look at that list from 2007 (first year the stat was tracked) to 2022. Not many surprises on that list. Then look at the 2023 list. More surprises, shorter sample size.

Andersen was the first name that made me go huh? Then you realize he has a 286 wins, 126 losses and 52 ties in his career with a career 0.914% save percentage on numerous different teams. The list wasn't the issue, my perception of Andersen was.

As a last note I don't think Vasilevskiy made the games played qualifier for the chart in case anyone is wondering why he isn't listed.
 
Last edited:
For sure. There are always what ifs with these stats. I find it slightly better than raw Save %. It is still telling when Price is first on the list by far and was protected by a dumpster fire his whole career.

Ya, using GSAx over one game sample sizes is borderline trolling. I find it better on aggregate over a longer period of time. Look at that list from 2007 (first year the stat was tracked) to 2022. Not many surprises on that list.

Andersen was the first name that made me go huh? Then you realize he has a 286 wins, 126 losses and 52 ties in his career with a career 0.914% save percentage on numerous different teams. The list wasn't the issue, my perception of Andersen was.

As a last note I don't think Vasilevskiy made the games played qualifier for the chart in case anyone is wondering why he isn't listed.
Thing is, we have a habit of assuming that teams that collapse, don't have much possession and give up high shot volumes are asking their goalies to stand on their head. Realistically, systems like this can actually be very good for goalie stats.

The 2015 Flames under Hartley played this style of hockey and made Jonas Hiller and Karri Ramo look very good. The style of hockey asks goalies to make a lot of comfortable saves and generally allows them to zone in on one shooter at a time as passing lanes are clogged. The volume and location of the shots lead to high expected goals, but the shooters generally are in unfavourable situations while trying to shoot compared to the average for each shot location.

I strongly believe that prime Carey Price would see mediocre stats playing for this year's Oilers or last year's Flames even while being an absolutely top class goalie and not making any mistakes.
 
  • Like
Reactions: GirardSpinorama
Thing is, we have a habit of assuming that teams that collapse, don't have much possession and give up high shot volumes are asking their goalies to stand on their head. Realistically, systems like this can actually be very good for goalie stats.

The 2015 Flames under Hartley played this style of hockey and made Jonas Hiller and Karri Ramo look very good. The style of hockey asks goalies to make a lot of comfortable saves and generally allows them to zone in on one shooter at a time as passing lanes are clogged. The volume and location of the shots lead to high expected goals, but the shooters generally are in unfavourable situations while trying to shoot compared to the average for each shot location.

I strongly believe that prime Carey Price would see mediocre stats playing for this year's Oilers or last year's Flames even while being an absolutely top class goalie and not making any mistakes.

Have you seen some of the teams he actually played for? I am a Montreal fan. We haven't had a player score over 85 points in his entire career and most seasons our defense was worse than our offense (how this is possible is a real embarrassment to our past management).

The oilers and flames are no worse and that is a sad truth. They both basically copied our model of failure. Look at our roster that went to the Stanley Cup finals a few seasons ago with Price playing with one working knee. Our defense was laughably bad that season. That roster shouldn't have even made the playoffs let alone multiple rounds.

Any stat can be nitpicked. I just feel what your saying is even worse with raw save %.

-Goalie A gets 30 shots per game with 2 high danger scoring chances (strong team).
-Goalie B gets 30 shots per game with 10 high danger scoring chances per game (weak team).
-Both have the same save % of 0.920.

Which one are you picking if you could add one to your team? Goalie B would be way higher on a GSAx list. Goalie B is Carey Price.
 
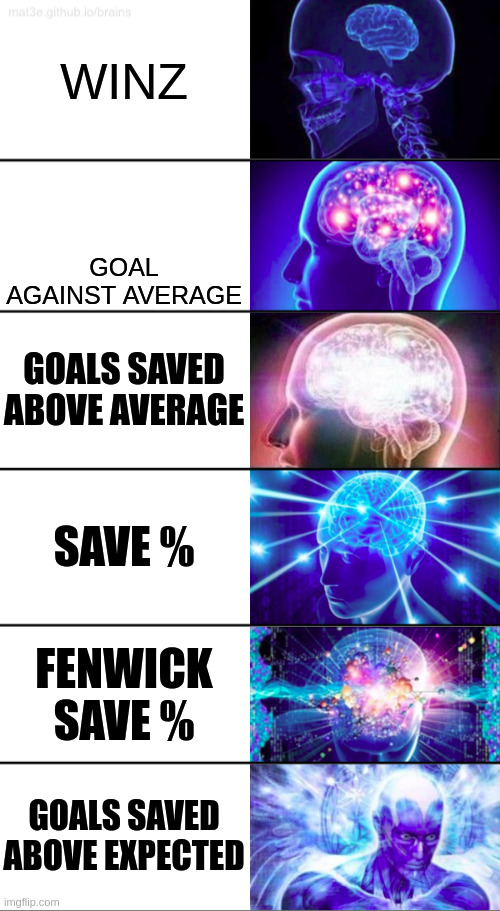
Save % is not the best goalie stat but it is not the worst either. Other stats that used to be used before sv% were even worse at isolating goalie impacts. Better stats exists but sv% is usually a good first order approximation of a goalie over a decent enough sample size

87ay72.jpg
 
Have you seen some of the teams he actually played for? I am a Montreal fan. We haven't had a player score over 85 points in his entire career and most seasons our defense was worse than our offense (how this is possible is a real embarrassment to our past management).

The oilers and flames are no worse and that is a sad truth. They both basically copied our model of failure. Look at our roster that went to the Stanley Cup finals a few seasons ago with Price playing with one working knee. That roster shouldn't have even made the playoffs let alone multiple rounds.

Any stat can be nitpicked. I just feel what your saying is even worse with raw save %.

-Goalie A gets 30 shots per game with 2 high danger scoring chances (strong team).
-Goalie B gets 30 shots per game with 10 high danger scoring chances per game (weak team).
-Both have the same save % of 0.920.

Which one are you picking if you could add one to your team? Goalie B would be way higher on a GSAx list. Goalie B is Carey Price.
Are you sure? Were those Habs teams routinely outshooting their opponents every game by wide margins? I don't believe so.

When I think of those Habs teams, both with Price and even Halak, I think of teams that were constantly getting caved in terms of possession, but this can actually be better for goalies as long as the team protects the dangerous areas.
 
  • Like
Reactions: GirardSpinorama
Are you sure? Were those Habs teams routinely outshooting their opponents every game by wide margins? I don't believe so.

When I think of those Habs teams, both with Price and even Halak, I think of teams that were constantly getting caved in terms of possession, but this can actually be better for goalies as long as the team protects the dangerous areas.
They lead the league multiple times in high danger scoring chances against during these years. When they were giving up 8 high danger chances per game and had 3 high danger chances for, that is not the same thing at all. You can't just look at shot totals.

Most bad teams have higher shot numbers and lower high danger scoring chances. When you suck you are taught to fire the puck at the net and hope for the best. Not all shots are created equal and that is a massive limitation of raw save %. What that really tells you is that Montreal sucked at entering the zone with control of the puck. Less controlled play / shot attempts. Less good scoring chances.

The year with Halak was one of the best Montreal teams iced during this period. I will try to dig up the stats for you later for all time with and without Price. Halak will look great and every other goalie will look abysmal. Add the fact that Price played the majority of the strongest teams and the "others" played this years San Jose Sharks (or Montreal Canadiens) the majority of this sample size.

Like I said go name the defense on Montreal's finals roster and try to argue with me how much worse that is than the oliers. It was one of the worse lineups I have seen in the playoffs, period. That lineup winning multiple rounds is all on Carey Price (with one knee completely striped, bone to bone). I think it is rediculous to think that prime Price couldnt help the Oilers or Flames.

Are there any terrible goalies on the GSAx top 10 list from 2007-2022? It is a who's who of the top goalies during that period,
 
Last edited:
Save % is not the best goalie stat but it is not the worst either. Other stats that used to be used before sv% were even worse at isolating goalie impacts. Better stats exists but sv% is usually a good first order approximation of a goalie over a decent enough sample size

87ay72.jpg

Someone needs to Photoshop Shaq saying "Ringz Ernie" at the top of this.
 

Users who are viewing this thread

Ad

Ad