Why would a goalie be "averages" and not any other player? Why are they the exception? It's anchoring bias. That's how the public data has been presented to you your whole life, so therefore it has intrinsic value to you (royal you). But does it?
I think you think you're saying something here, but of course not, skaters (especially 5 on 5) play a free-flowing game, up and down, sometimes a team has possession a lot longer, some teams create more dangerous opportunities. So we don't care as much about "averages" because doing things like controlling possession, creating more chances, very valuable. How does that relate to goaltenders?
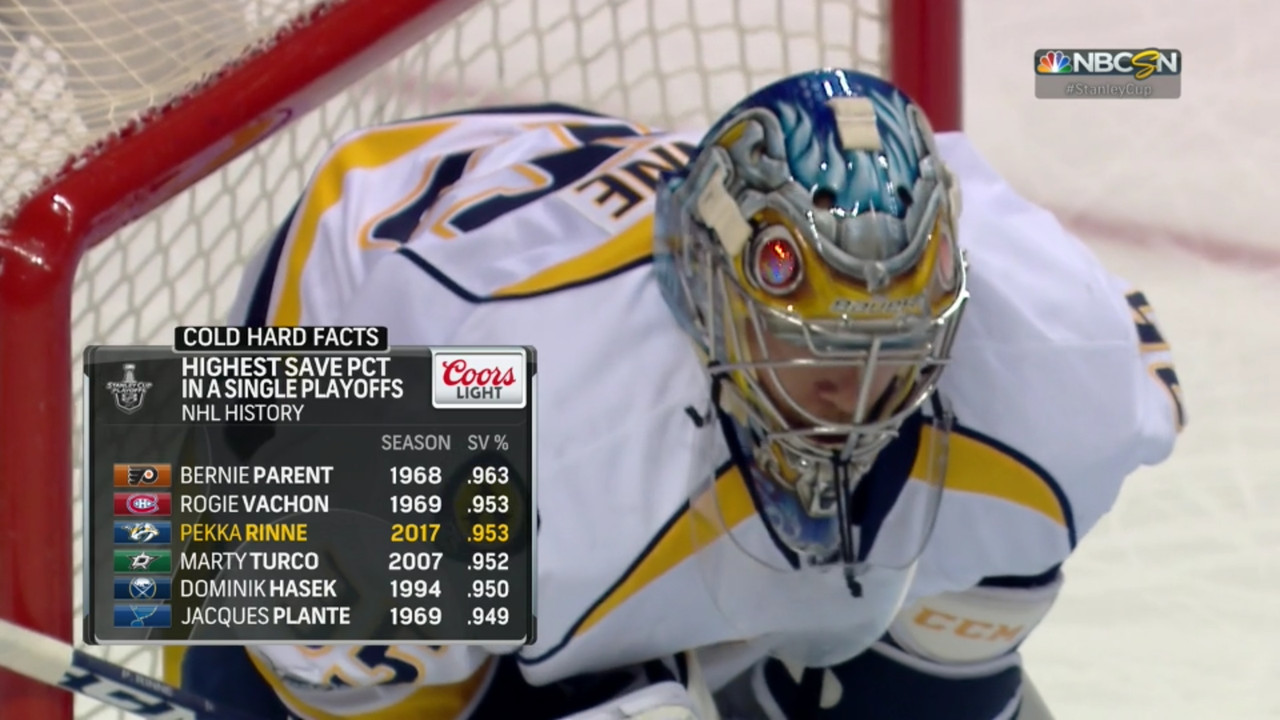
Most of the very best save pct. performances in Stanley Cup Playoff history are all first round exits. Saves don't have any value on their face...it's the expected result. 98% of unscreened, un-deflected shots are stopped.
yes, this is how small sample sizes work. Sam Gagner had 8 points one game, that doesn't make him the best player ever at peak value because of that one game
So, once again, I regret to inform everyone that there's no easy button.
Nobody said it was...
The easiest way to go about it is to evaluate goals against.
So one rate stat for a different one..?
And I don't mean just the totals...but the quality and timeliness of the goals against. Nothing affects a bench more than a bad goal against. That really lets the air out of the balloon for a team.
Ok, so not save % or GAA, but the "Michael Farkas Certified Bad Goal Against That Really Lets the Air out of a Balloon"... that's still an averaging/rate stat. If you don't like save %, fine, I doubt anyone considers a certified end all be all, sort by SV%, call it a day and be done. Whether you use a real or hypothetical different measure, you're still measuring a goaltender by a rate, based on shots faced, minutes played, you have to. It's the nature of the position in the sport they play. In baseball, we measure everything by rate, because how else can you? By plate appearances or pitches thrown just shows how much a manager believed in you/how they viewed you compared to alternative options, but it says nothing about actual performance. Similar to a goaltender. You can make a note if a guy started 65 games a bunch of years in a row and the implication of that, but the performance itself is going to be rate-based.
Given how highlights are cut up, it'd be relatively easy to evaluate goalies on just the goals they give up and that would paint a better picture than the one we have now.
It'd be relatively easy? Interesting theory... So you only look at the goals given up and not the save made? Why not both?
But, if a goalie's job is to stop pucks - reductive as that may be - why would you be interested in how many times per game he made saves?
For one, it's a measure of how effectively he was in fact stopping pucks. If you think a 5 save shutout is the same as a 50 save shutout, that's a different one for me.
Or allowed goals (it's hard to ascertain your meaning)?
Which goalie do you want?
Goals against of: 10, 1, 1, 0, 0
or
Goals against of: 3, 3, 4, 2, 0
2ish GAA for both. In the scoring environment we're talking about, we probably are down 3 games to 2 with that second goalie. Maybe we're up 3-2. With the first goalie, we've almost certainly advanced already.
Now you're just talking about about distribution/variance. Can do that all day? Would you rather have the guy that has 12 hat tricks and doesn't score any other time or the guy that scores 1 goal in 36 different games? We can of course look back on an actual distribution/variance, it's less certain what we can glean out of that if we're looking at a go-forward basis in terms of "which goalie do you want next season?"
It's just shorthand silliness to avoid proper talent evaluation.
It's a tool, like every other tool. We look at a forwards goals/point totals and make a determination out of that.. it's a shorthand, and it may mean less "proper talent evaluation" which is a subjective thing with plenty of room for disagreement.
And I'm not saying it doesn't make sense...and I'm not saying save pct. is completely worthless (that exercise was done recently here)...but we don't take hardly any skaters stats as pure gospel.
Calling save percentage "pure gospel" is a strawman. I don't think Ben Bishop is treated as a top all time goaltender for instance.
We adjust points and explain away plus/minus and all this - and that's right too...but for some reason, we think save pct. is just impervious...
Yes that would be bad if people were doing this. Luckily, that doesn't happen. Now when we go too far the other way and use our "proper talent evaluation" and ignore performance based metrics.. it starts to just look like a person with a bias that doesn't want to come off their preconceived notions.
doesn't make sense to me. Doesn't make sense to other people that evaluate goalies either.
Not sure who this appeal to authority is directed at.