rubenflamshep
Registered User
I've created a tool that, building on a some previous work (see Acknowledgements below), allows us to score each NHL team's draft performance.
Basically, for each NHL draft pick 1 through 200ish we can look at the average number of NHL games played by each pick. Schuckers notices that there's high variability in the average number of NHL games played by later picks:

We can smooth this by taking a rolling average for each pick that includes the 4 picks before and after:

This gives us an "expected games played curve" (eGP curve); the number of games you would expect a draft pick to play over their entire NHL career¹.
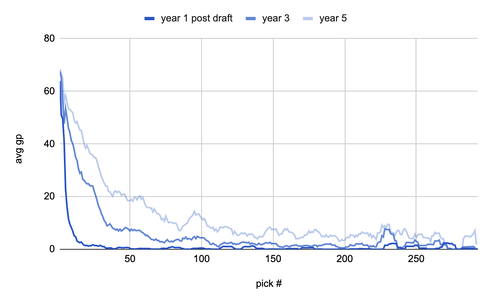
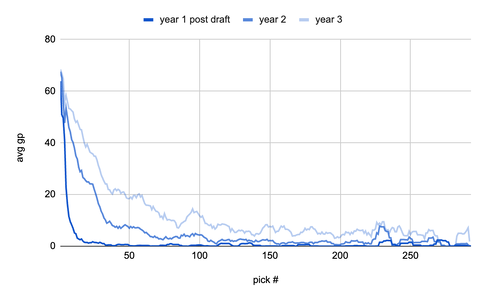
We can take this one step further by breaking out the eGP curve into separate years post-draft. So you'd have a separate curve for Y1 post draft, Y2, etc. They would look something like this:

Now we have this set of eGP curves and each draft pick's actual number of games played each year post draft. Subtracting the actual GP against the expected GP for each year gives us a score for that pick. We sum up those scores for every pick a team makes and we can score each team's draft performance across different periods of time!
To that end, scoring each team's draft over the last ten years, including 7 years post-draft for each pick reveals the following:

The time period and number of post-draft years to include are both customizable. You can also click into a team to reveal the picks that make up their score as well as an individual pick to see how that pick developed:

There are some obvious limitations:
")
¹There are some intricacies that should be acknowledged/discussed here (e.g., later picks are very bimodal; they likely either have a decent NHL career or 0 games) but I'm going to gloss over them for the sake of keeping the length of this post manageable.
Acknowledgements:
Schuckers' seminal work used a 200GP threshold and looked at the probability of each pick becoming an NHL player (using a 200GP threshold). Moreau builds on this using some very mathy functional data analysis. Nandakumar actually rates each NHL team's draft using a game-theory-based retrospective scoring system.
Basically, for each NHL draft pick 1 through 200ish we can look at the average number of NHL games played by each pick. Schuckers notices that there's high variability in the average number of NHL games played by later picks:
We can smooth this by taking a rolling average for each pick that includes the 4 picks before and after:
This gives us an "expected games played curve" (eGP curve); the number of games you would expect a draft pick to play over their entire NHL career¹.
We can take this one step further by breaking out the eGP curve into separate years post-draft. So you'd have a separate curve for Y1 post draft, Y2, etc. They would look something like this:
Now we have this set of eGP curves and each draft pick's actual number of games played each year post draft. Subtracting the actual GP against the expected GP for each year gives us a score for that pick. We sum up those scores for every pick a team makes and we can score each team's draft performance across different periods of time!
To that end, scoring each team's draft over the last ten years, including 7 years post-draft for each pick reveals the following:
The time period and number of post-draft years to include are both customizable. You can also click into a team to reveal the picks that make up their score as well as an individual pick to see how that pick developed:
There are some obvious limitations:
- It doesn't account for injure/death so the Leafs get heavily penalized for their pick of Rodion Amirov who unfortunately died of brain cancer (maybe have a list of null players that don't get scored?)
- This doesn't account for "star power" to a degree. The Avalanche get penalized for Cale Makar who look an extra year to develop (maybe use avg point share instead of avg gp?).
¹There are some intricacies that should be acknowledged/discussed here (e.g., later picks are very bimodal; they likely either have a decent NHL career or 0 games) but I'm going to gloss over them for the sake of keeping the length of this post manageable.
Acknowledgements:
Schuckers' seminal work used a 200GP threshold and looked at the probability of each pick becoming an NHL player (using a 200GP threshold). Moreau builds on this using some very mathy functional data analysis. Nandakumar actually rates each NHL team's draft using a game-theory-based retrospective scoring system.