
Hello all,
So one thing I’ve been curious about is not only the success rate of picks in the mid range of the first round (and no man’s land as some fans like to call it) and how long it takes for players to actually make the NHL roster and then become actual contributors. The methodology used for this does involved a bit of subjectivity based on the various roles I assigned to a player and when I considered them to be a full time NHLer (some spent a good chunk between the AHL and the NHL) and when they became contributors. Elements like ice time and production came into play for the contributor aspect.
Another thing I was especially curious about is the picks in the 16-22 range since these represent prospects and historical data that is useful to help evaluate what would be the best outcome with the team’s two first round picks in this year’s draft and what to expect not only as far as outcome of these picks but also most likely timeline for them.
Last tidbit, the reason why I decided to include a wider array of picks (12-15 and say 20-22) is to see whether the theory that deeper you go into the draft, the more it becomes a crapshoot. If that is indeed the case, then even more power to trying to move up in the draft. This also allowed to have a much bigger sample size for data.
I looked at the drafts from 2006 all the way to 2021. Some of these will have TBD since it’s still a bit too early to tell, but it also comes with the fact that these players are all in their D+4 years or even longer and still not close to being established. There are 3 N/As, they are players that have passed away (Amirov and Cherepanov) or had to retire due to health conditions (Lucius).
So looking only at the data for the pick MTL possesses: pick 16 and 17 (sample size of 32 players).


D+4 (25%) is the most common timeline followed by players never making it (19%) and then D+3 (16%).
For contributing, D+6 is also the most common (22%), followed by becoming a regular (19%) and D+3 (19%).
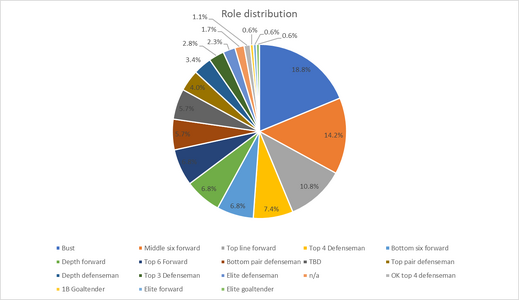
The type of players those ranks have contributed consist almost a third of busts or lower tier players (middle 6 players, bottom 6 players or bottom pair).
__________________________________________
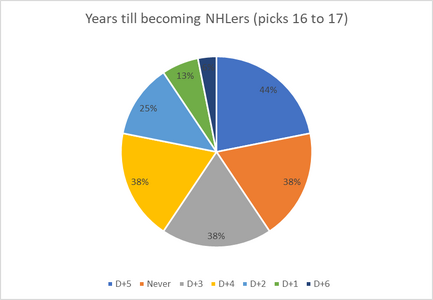
For picks in the 12/13 range (sample size of 32 players):


When comparing the data to players in the 12/13 range, interestingly enough, there are 2x more busts than in the 16/17 range and D+5 is the most common path at 44% which represents a whole extra year than the later picks. However, the number of players making it in D+3 is about the same.
However the big difference is the quality of the players for the ones that make it. 81% of them are impactful players and half of the sample is among the cream of the crop of the league. Comparatively, 38% of the players are impactful players and only 19% would fall in the cream of the crop category. So the risk is higher but the reward is also much higher, scouting makes the difference.
My conclusion is given the age of our core and the team potentially being done with the rebuild, it should be an objective to move up, even if it by just a few picks so the team can get some top talent even if it takes longer for them to make the team. I think the scouting staff has earned the benefit of the doubt on them not whiffing this pick.
__________________________________________________________________________________
For those curious of how the global numbers look like, sample size of 176 players.


Looking only at picks 16-22 data:


Sorry for the multiple charts, HFBoards has been a PITA ever since the big crash for tables but I can share the full tables later on, graphs was the easiest way for me to share this info with current limitations.
So one thing I’ve been curious about is not only the success rate of picks in the mid range of the first round (and no man’s land as some fans like to call it) and how long it takes for players to actually make the NHL roster and then become actual contributors. The methodology used for this does involved a bit of subjectivity based on the various roles I assigned to a player and when I considered them to be a full time NHLer (some spent a good chunk between the AHL and the NHL) and when they became contributors. Elements like ice time and production came into play for the contributor aspect.
Another thing I was especially curious about is the picks in the 16-22 range since these represent prospects and historical data that is useful to help evaluate what would be the best outcome with the team’s two first round picks in this year’s draft and what to expect not only as far as outcome of these picks but also most likely timeline for them.
Last tidbit, the reason why I decided to include a wider array of picks (12-15 and say 20-22) is to see whether the theory that deeper you go into the draft, the more it becomes a crapshoot. If that is indeed the case, then even more power to trying to move up in the draft. This also allowed to have a much bigger sample size for data.
I looked at the drafts from 2006 all the way to 2021. Some of these will have TBD since it’s still a bit too early to tell, but it also comes with the fact that these players are all in their D+4 years or even longer and still not close to being established. There are 3 N/As, they are players that have passed away (Amirov and Cherepanov) or had to retire due to health conditions (Lucius).
So looking only at the data for the pick MTL possesses: pick 16 and 17 (sample size of 32 players).
D+4 (25%) is the most common timeline followed by players never making it (19%) and then D+3 (16%).
For contributing, D+6 is also the most common (22%), followed by becoming a regular (19%) and D+3 (19%).
The type of players those ranks have contributed consist almost a third of busts or lower tier players (middle 6 players, bottom 6 players or bottom pair).
__________________________________________
For picks in the 12/13 range (sample size of 32 players):
When comparing the data to players in the 12/13 range, interestingly enough, there are 2x more busts than in the 16/17 range and D+5 is the most common path at 44% which represents a whole extra year than the later picks. However, the number of players making it in D+3 is about the same.
However the big difference is the quality of the players for the ones that make it. 81% of them are impactful players and half of the sample is among the cream of the crop of the league. Comparatively, 38% of the players are impactful players and only 19% would fall in the cream of the crop category. So the risk is higher but the reward is also much higher, scouting makes the difference.
My conclusion is given the age of our core and the team potentially being done with the rebuild, it should be an objective to move up, even if it by just a few picks so the team can get some top talent even if it takes longer for them to make the team. I think the scouting staff has earned the benefit of the doubt on them not whiffing this pick.
__________________________________________________________________________________
For those curious of how the global numbers look like, sample size of 176 players.
Looking only at picks 16-22 data:
Sorry for the multiple charts, HFBoards has been a PITA ever since the big crash for tables but I can share the full tables later on, graphs was the easiest way for me to share this info with current limitations.


")