- Apr 30, 2026
- 36
- 26
I'm very interested in how analytics may be useful in both interpreting performance or "predicting" possible performance moving forward. I see issues and consistency problems when interpreting stats related to both proxies for possession or shot quality.
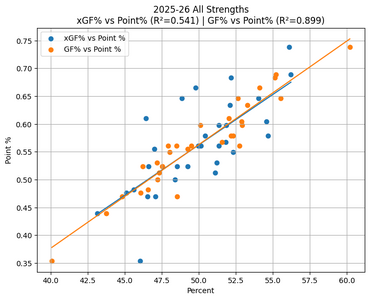
Possession proxies seem less interesting to me at the moment, so starting with xGF. When looking at a seasons worth of data. And evaluating xGF for the top and bottom teams (as measured by wins, losses, points or goals). I'm not seeing consistent patterns or consistent explanations for variance, (beyond goals or W/L). I realize a single number can't tell the entire story, just interested in how others are using this information.
If anyone has had a different experience, Could you post some solid statistical usage that you have found reliable using xGF or other "analytics".
Last edited: